Radiologia Brasileira - Publicação Científica Oficial do Colégio Brasileiro de Radiologia
AMB - Associação Médica Brasileira CNA - Comissão Nacional de Acreditação
 Vol. 43 nº 4 - July / Aug. of 2010
|
REVIEW ARTICLE
|
|
Accuracy of measurement of pulmonary emphysema with computed tomography: relevant points |
|
|
Autho(rs): Bruno Hochhegger1; Edson Marchiori2; Klaus L. Irion3; Hugo Oliveira4 |
|
|
Keywords: Accuracy; Measurement; Pulmonary emphysema; Computed tomography. |
|
|
Abstract: INTRODUCTION
Pulmonary emphysema is defined as "abnormal and permanent enlargement of the air spaces distal to the terminal bronchioles, accompanied by the destruction of alveolar walls, without evident fibrosis"(1). This disease is a burden for the public health sector and occupies the 12th position among the causes of loss of quality-of-life, with a forecast of moving to the 5th position by the year of 2020(2). Computed tomography (CT) is currently the method of choice for the non-invasive evaluation of pathological alterations involved in emphysema, and has demonstrated a good correlation with the pathology(3). The introduction of multidetector-row helical CT (MDCT) has opened up new horizons. In this type of equipment it is possible to carry out a continuous scan along the whole extent of the chest within a single five-second breath hold. The result of such scan is a data volume and not only a data matrix, as it is the case with high resolution CT (HRCT). Studies report the use of only three tomographic sections for the evaluation of pulmonary emphysema(4). However, the subtypes of heterogeneous emphysema shall be comprehensively evaluated. Nowadays MDCT apparatuses are widely available in the market. Thanks to MDCT, it is possible to create 3D reconstructions with accurate volumes measurement, a technological resource that has played an increasing role in the investigation of chest alterations(5,6). The basis for the measurement of pulmonary emphysema at MDCT is the Hounsfield scale. Such scale is divided into 2,048 radiodensity levels, with 0 (zero) being the distilled water radiodensity and -1000 being the air radiodensity. The emphysematous areas are in a density range lower than that of a healthy pulmonary parenchyma, and can therefore be quantified by measuring the volume of a radiodensity range on the Hounsfield scale. Thus, the quantification of the volume of pulmonary emphysema is given by an emphysema index (EI), which is represented by pulmonary volumes with density similar to that of emphysema divided by the pulmonary volumes with the density of a healthy lung. The threshold between a healthy lung and the emphysematous parenchyma has been the subject of studies by many authors(5,6). Studies developed previously to the availability of MDCT reported slices thicknesses around 10 mm, which do not allow comparison with the data from MDCT. It was the studies in HRCT developed with healthy patients by Gevenois et al.(5) on the threshold at -950 Hounsfield units (HU), that allowed for greater assurance with respect to the correlation between thin slices and tomographic measurement of emphysema. Most recently, Madani et al.(6) investigated such thresholds in MDCT and proposed the values of -950 HU and -970 HU. Attention should be given to the fact that in spite of the study by Madani et al.(6) having been developed with MDCT, axial sections were utilized for histopathological comparison. Therefore, their data are obviously expressed in area and not in volume. With a view on these factors, CT was recently recommended in a workshop on CT sponsored by the European Respiratory Society (3), as the method of choice for the management of longitudinal studies on pulmonary emphysema. In the present study, the authors conclude that the use of CT is the safest and most appropriate way to determine the rate of emphysema progression in the follow-up of interventions as compared with the decrease in forced expiratory volume in one second (FEV1)(3). For a safer and greater utilization of CT in the measurement and follow-up of pulmonary emphysema, the variability derived from different techniques utilized in such measurement must be taken into consideration. This is extremely important, considering that the knowledge about such variations is essential for the definition of pulmonary emphysema progression. The accuracy in quantifications by CT is particularly dependent on the protocols and acquisition techniques employed. The selection and variation of technical parameters (for example slice thickness, tube current, exposure time and reconstruction algorithm) are important, and are many times clinically forgotten. Although many factors such as patient's pulmonary dimension and volume may affect the final image, the selection of the techniques is the most easily adjustable parameter, and the only one that have demonstrated influence on the comparability of extracted data(7). The main parameters reported in the literature and that have demonstrated influence on emphysema measurements are described in the present review article. THE RADIATION DOSE There is currently a trend towards the reduction of radiation doses utilized at CT. The variability described for the radiation dose at chest CT can achieve 1000%(8,9). The justification for the use of very low doses lies on the fact that the radiation dose poses an intrinsic risk of inducing the development of neoplasias(10). The image quality seems to be acceptable for the evaluation of normal anatomic structures, even with a 50% decrease in the radiation dose(11). The problem with the utilization of low doses, particularly in cases of pulmonary emphysema, is the poor contrast between the healthy and the emphysematous parenchyma. In this situation, there is an increase in the image noise level, which causes an increase in the emphysema index (Figure 1)(12). Such an effect can be reduced but not excluded, by means of a noise reduction filter(9). Previous studies describe the influence of the radiation dose on emphysema measurements, with statistically significant influence(8,9,13)(Figure 1). 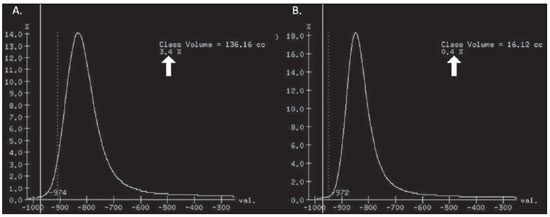 Figure 1. A: Histogram of densities for the calculation of pulmonary emphysema with CT in a non-smoking young patient, utilizing a dose of 120 kV and 10 mAs. The pulmonary emphysema index (arrow) was 3.4%, with a threshold at 950HU. B: CT image of the same patient, utilizing a dose of 120 kV and 200mAs. The pulmonary emphysema index was 0.4% (arrow), a threshold at 950 HU. Observe the significant decrease in pulmonary emphysema indices with the increase in dose and reduction in noise, providing a more accurate measurement of pulmonary emphysema. THE FILTER High resolution algorithms (denominated Bone, B60, FC50) have been developed to make the identification of structure margins or borders easier, changing the original HUs of the interface zones, and attributing new values that are similar to those of the adjacent structure. Such image processing is very useful for the visual analysis of the emphysema, since it simplifies the data for the human eye. The human eye is capable of differentiating 40,000 shades in the gray scale. However, in order to identify something as a single structure mingled among several shades of gray, it is necessary that the gray-scale thresholds be well defined. It is such data manipulation that high-resolution filters provide: they group the similar densities to make the gray-scale thresholds better defined. However, computers do not require such artificial treatment of raw data, since, based on such raw data, they can measure the attenuation value of each individual pixel. Once a high-resolution filter is applied, the computer will measure the new, artificially created value for each interface zone. As the data are reconstructed at CT with different algorithms, the mean HU value of a region should remain the same, but the distribution of the attenuation values and therefore the measurement resulting from such distribution will change(14). This explains why the total pulmonary volume is stable while the emphysema indices are altered(15). As already demonstrated, the selection of a filter or reconstruction algorithm influences the images spatial resolution. Previous studies indicate a strong relationship of such filters, particularly the high-resolution ones, with the measurement of emphysema (Figure 2)(15). Boedeker et al.(14) have described variations of 28% to 45%. On the other hand, Kemerink et al.(15,16) have reported that in homogeneous zones with large areas of measured emphysema, the filters would not have caused significant changes in the measurements. In another study, the same group(17) reports the experiment with heterogeneous zones, demonstrating a strong influence. In a recent study, Ley-Zarporozhan et al.(18), utilizing multidetector-rows CT apparatuses, demonstrated a strong influence of such filters on the measurement of emphysema.  Figure 2. A: Three-dimensional representation of pulmonary emphysema index measured with the usual dose and without high-resolution filter. The emphysema index was 4%. B: Three-dimensional representation of pulmonary emphysema index measured with the usual dose and high-resolution filter. The emphysema index was 29%. Observe the significant influence of the post-processing filters on the evaluation of emphysema. CT SLICE THICKNESS The theory on which the alterations of emphysema indices in relation to the slice thickness is based upon consists in the fact that thinner slices result in increased noise on the images and therefore, increased mean densities of the regions and decreased emphysema indices. Such effect of slices thickness on the measurement of emphysema is smaller than the influence of the filter(8). However, variations are reported to achieve 2% of the emphysema indices with slice thickness variations between 1.25 mm and 10 mm (Figure 3)(8). Such variation alone is of little importance, but must be considered, as together with the other variables, may present significant alterations. The European Society of Pneumology recommends a slice thickness of 1 mm for MDCT(3).  Figure 3. A: Histogram of densities for the calculation of pulmonary emphysema with CT utilizing a dose of 120 kV, 200 mAs and 5 mm slice thickness. The pulmonary emphysema index was 0.6% (arrow), with a threshold at 950 HU. B: CT image of the same patient utilizing a dose of 120 kV, 200 mAs and 0.6 mm slice thickness. The pulmonary emphysema index was 2.2% (arrow), with a threshold at 950 HU. Observe the increased pulmonary emphysema index with the reduction of the slice thickness. THE INSPIRATORY LEVEL The tomographic density measurement is represented in HUs (Hounsfield units). The Hounsfield scale is (approximately) defined as -1000 HU for the air, 0 HU for distilled water and 1000 HU for the bone. Essentially, the lungs comprise two types of density: air (measuring approximately -1000 HU) and "tissue" (including blood, cells, water, etc., which have approximate densities of 0 HU). This tomographic density measurement may be directly converted into the quantity of air and tissues present in a given region of interest (ROI) on images of the pulmonary parenchyma. For example, a region with a density of -600 HU contains on average 60% of air and 40% of "tissue"(17). By this principle, the lung in expiration is denser than the lung in inspiration. In this same context, the variation in the inspiratory level will have an influence on the lungs density and, consequently, on the measurement of the emphysema indices (Figure 4). Based on these findings, inspiratory coaching methods have been developed for the measurement of emphysema by means of spyrometric gating. Such inspiratory coaching methods regulate the inspiration using always the same volumes and theoretically, should provide better reproducibility. Nowadays, studies demonstrate that such methods do not significantly affect the measurement of emphysema(19). The small variations (up to 200 ml) in the maximum inspiratory level of the patient have no significant influence on the measurements of emphysema, however, in cases of variations above 200 ml, the utilization of computer softwares is recommended in order to compensate the smaller pulmonary volume by means of a mathematical analysis between the volume variations(20). 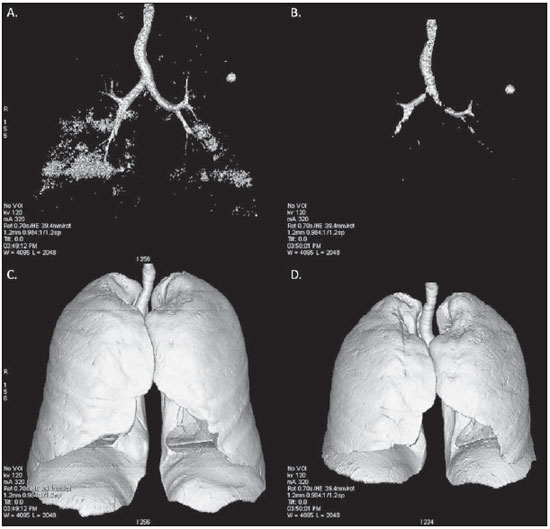 Figure 4. A: Three-dimensional representation of the pulmonary emphysema index measured at inspiration. The emphysema index was 4%. B: Three-dimensional representation of the pulmonary emphysema measured at expiration. The emphysema index was 2%. C,D: Three-dimensional demonstration of total pulmonary capacity at inspiration (4.3 liters) and at expiration (2.6 liters). The difference demonstrates the influence of the inspiratory level on the measurement of pulmonary emphysema. THE DIFFERENT TYPES OF CT SCANNERS The types of CT scanners do not affect the total pulmonary volume measurements, which are obtained by utilizing a simple segmentation of low-attenuation regions (lungs) and high-attenuation regions (chest walls and soft tissues)(21,22). However, different apparatuses do significantly affect the measurements of pulmonary density and emphysema volume(21,22). Such alterations are due, at least in part, to the level of noise at imaging studies(21,22). Such increased noise level is intrinsic to the type of material used in the manufacture of the equipment (X-ray sensors and tube) and the image processing software. The noise causes amplification of frequency distribution of lung attenuation values. On the central regions of the Hounsfield scale (for example, water, 0 HU), the amplification of the distribution of frequency of lung attenuation values is symmetrical and there is no change in the mean attenuation value. However, at very low attenuations or at the extreme values of the Hounsfield scale (for example emphysema or hyperinflated pulmonary tissue) the effect of increased noise levels and amplification of the frequency of distribution of lung attenuation values is not symmetrical(21,22). This greater asymmetry in the density distribution affects the emphysema volumes, as the emphysema measurements are based on a fixed threshold and any change in the density distribution due to noise, will result in changes of volumes comprised below such threshold(21,22). Currently, there is a consensus on the utilization of MDCT in the evaluation of pulmonary emphysema(3). SOFTWARES FOR MEASUREMENT OF INDEX OF EMPHYSEMA There are many computer softwares for the evaluation of pulmonary emphysema index (23-26). All of them are based on the quantification of the areas with densities similar to those of emphysema. The main difference among such softwares is the manner by which the pulmonary parenchyma is excluded: some utilize an automatic density recognition method, while others rely on the operator to select the lung. A wide variability is observed in this aspect(24,25), which causes a variability in the total pulmonary volume and, consequently, in the index of emphysema. Such factor is aggravated because a maximum pulmonary density value is not obtained (some utilize -250 HU, while others utilize -400 HU). Heussel et al.(25) have tested four different computer programs in the same patients and have found statistically significant differences between measurements. The easiest method to manage such factors is to perform the measurement always with the aid of a same software and according to the same parameters(23). THE USE OF INTRAVENOUS CONTRAST The changes detected after contrast injection show an increase in the pulmonary parenchyma density (Figure 5)(27). Therefore, the amount of quantified emphysema decreases after the use of contrast. Due to this fact, intravenous iodinated contrast injection cannot be used in longitudinal studies. 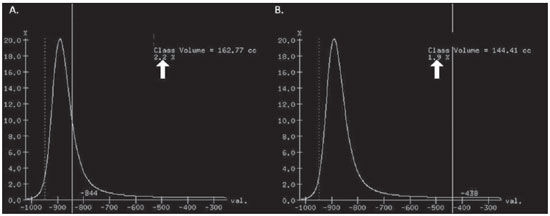 Figure 5. A: Histogram of densities for the calculation of pulmonary emphysema with non-contrast-enhanced CT. The pulmonary emphysema index was 2.2% (arrow), with a threshold at 950 HU. B: Contrast-enhanced CT image of the same patient, keeping the other parameters constant. The pulmonary emphysema index was 1.9% (arrow), with a threshold at 950 HU. Observe the decreased pulmonary emphysema indices with the use of intravenous contrast because of the increased in the mean pulmonary density. It must be highlighted that the measurement of pulmonary emphysema by CT is subject to a wide range of variables. However, they are easily controllable and can be excluded. In order to guarantee the reproducibility of the measurements of the emphysema, a single CT equipment, radiation dose, processing algorithm, post-processing software and CT slice thickness should be used. Additionally, the differences between total pulmonary volumes should not be > 200 ml (and in case they are, they should be adjusted by means of specific software). In the authors' experience, the greatest problem with reproducibility of these studies is maintaining the pulmonary volumes. However, the authors have been able to achieve the reproducibility of pulmonary volumes in approximately 85% of the patients as a result of clear and easily understandable guidance of the patients. Finally, more safe and reliable measurements of pulmonary emphysema can be performed, provided the described variables remain constant. REFERENCES 1. [No authors listed]. The definition of emphysema. Report of a National Heart, Lung, and Blood Institute, Division of Lung Diseases workshop. Am Rev Respir Dis. 1985;132:182-5. 2. Murray CJ, Lopez AD. Evidence-based health policy - lessons from the Global Burden of Disease Study. Science. 1996;274:740-3. 3. Newell JD Jr, Hogg JC, Snider GL. Report of a workshop: quantitative computed tomography scanning in longitudinal studies of emphysema. Eur Respir J. 2004;23:769-75. 4. Marsh S, Aldington S, Williams MV, et al. Utility of lung density measurements in the diagnosis of emphysema. Respir Med. 2007;101:1512-20. 5. Gevenois PA, De Vuyst P, de Maertelaer V, et al. Comparison of computed density and microscopic morphometry in pulmonary emphysema. Am J Respir Crit Care Med. 1996;154:187-92. 6. Madani A, Zanen J, de Maertelaer V, et al. Pulmonary emphysema: objective quantification at multi-detector row CT - comparison with macroscopic and microscopic morphometry. Radiology. 2006;238:1036-43. 7. Stoel BC, Bode F, Rames A, et al.Quality control in longitudinal studies with computed tomographic densitometry of the lungs. Proc Am Thorac Soc. 2008;5:929-33. 8. Madani A, de Maertelaer V, Zanen J, et al. Pulmonary emphysema: radiation dose and section thickness at multidetector CT quantification - comparison with macroscopic and microscopic morphometry. Radiology. 2007;243:250-7. 9. Stolk J, Dirksen A, van der Lugt AA, et al. Repeatability of lung density measurements with low-dose computed tomography in subjects with alpha-1-antitrypsin deficiency-associated emphysema. Invest Radiol. 2001;36:648-51. 10. Irion KL, Marchiori E, Hochhegger B, et al. CT quantification of emphysema in young subjects with no recognizable chest disease. AJR Am J Roentgenol. 2009;192:W90-6. 11. Prasad SR, Wittram C, Shepard JA, et al. Standard-dose and 50%-reduced-dose chest CT: comparing the effect on image quality. AJR Am J Roentgenol. 2002;179:461-5. 12. Schilham AM, van Ginneken B, Gietema H, et al. Local noise weighted filtering for emphysema scoring of low-dose CT images. IEEE Trans Med Imaging. 2006;25:451-63. 13. Zaporozhan J, Ley S, Weinheimer O, et al. Multidetector CT of the chest: influence of dose onto quantitative evaluation of severe emphysema: a simulation study. J Comput Assist Tomogr. 2006;30:460-8. 14. Boedeker KL, McNitt-Gray MF, Rogers SR, et al. Emphysema: effect of reconstruction algorithm on CT imaging measures. Radiology. 2004;232:295-301. 15. Kemerink GJ, Kruize HH, Lamers RJ, et al. CT lung densitometry: dependence of CT number histograms on sample volume and consequences for scan protocol comparability. J Comput Assist Tomogr. 1997;21:948-54. 16. Kemerink GJ, Lamers RJ, Thelissen GR, et al. Scanner conformity in CT densitometry of the lungs. Radiology. 1995;197:749-52. 17. Kemerink GJ, Lamers RJ, Thelissen GR, et al. CT densitometry of the lungs: scanner performance. J Comput Assist Tomogr. 1996;20:24-33. 18. Ley-Zaporozhan J, Ley S, Weinheimer O, et al. Quantitative analysis of emphysema in 3D using MDCT: influence of different reconstruction algorithms. Eur J Radiol. 2008;65:228-34. 19. Gierada DS, Yusen RD, Pilgram TK, et al. Repeatability of quantitative CT indexes of emphysema in patients evaluated for lung volume reduction surgery. Radiology. 2001;220:448-54. 20. Dirksen A. Monitoring the progress of emphysema by repeat computed tomography scans with focus on noise reduction. Proc Am Thorac Soc. 2008;5:925-8. 21. Yuan R, Mayo JR, Hogg JC, et al. The effects of radiation dose and CT manufacturer on measurements of lung densitometry. Chest. 2007;132: 617-23. 22. Stoel BC, Bakker ME, Stolk J, et al. Comparison of the sensitivities of 5 different computed tomography scanners for the assessment of the progression of pulmonary emphysema: a phantom study. Invest Radiol. 2004;39:1-7. 23. Irion KL, Marchiori E, Hochhegger B. Tomographic diagnosis of pulmonary emphysema. J Bras Pneumol. 2009;35:821-3. 24. Irion KL, Hochhegger B, Marchiori E, et al. Chest X-ray and computed tomography in the evaluation of pulmonary emphysema. J Bras Pneumol. 2007;33:720-32. 25. Heussel CP, Achenbach T, Buschsieweke C, et al. Quantification of pulmonary emphysema in multislice-CT using different software tools. Rofo. 2006;178:987-98. 26. Irion KL, Hochhegger B, Marchiori E, et al. Proteus syndrome: high-resolution CT and CT pulmonary densitovolumetry findings. J Thorac Imaging. 2009;24:45-8. 27. Heussel CP, Kappes J, Hantusch R, et al. Contrast enhanced CT-scans are not comparable to nonenhanced scans in emphysema quantification. Eur J Radiol. 2010;74:473-8. 1. MD, Chest Radiologist of Hospital Moinhos de Vento, Radiologist of Hospital Dom Vicente Scherer - Santa Casa de Porto Alegre, Porto Alegre, RS, Brazil 2. Titular Professor of Radiology at Universidade Federal Fluminense (UFF), Niterói, RJ, Associate Coordinator of the Course of Post-Graduation in Radiology, Universidade Federal do Rio de Janeiro (UFRJ), Rio de Janeiro, RJ, Brazil 3. MD, PhD, Consultant Chest Radiologist of Liverpool Heart and Chest Hospital, Liverpool, United Kingdom 4. Professor of Medicine at Universidade Federal do Rio Grande do Sul (UFRGS), Porto Alegre, RS, Brazil Study developed at Hospital Moinhos de Vento and Hospital Dom Vicente Scherer - Santa Casa de Porto Alegre, Porto Alegre, RS, Brazil Mailing address: Dr. Bruno Hochhegger Rua João Alfredo, 558, ap. 301. Cidade Baixa 90050-230. Porto Alegre, RS, Brazil E-mail: brunohochhegger@googlemail.com Received March 29, 2010 Accepted after revision April 23, 2010 |
|
Av. Paulista, 37 - 7° andar - Conj. 71 - CEP 01311-902 - São Paulo - SP - Brazil - Phone: (11) 3372-4544 - Fax: (11) 3372-4554