Radiologia Brasileira - Publicação Científica Oficial do Colégio Brasileiro de Radiologia
AMB - Associação Médica Brasileira CNA - Comissão Nacional de Acreditação
 Vol. 44 nº 3 - May / June of 2011
|
ORIGINAL ARTICLE
|
|
Transfusional iron overload in patients with sickle cell anemia: comparison between magnetic resonance imaging and serum ferritin |
|
|
Autho(rs): Lécio dos Anjos Bourbon Filho1; Thiago de Oliveira Ferrão2; Alex Vianey Callado França3; Ricardo Dantas Rocha1; Lorena Dias Dantas1; Luciana Franco do Prado Carvalho1; Marcella Dornelas de Abreu Batalha Moreira1; Rosana Cipolotti4 |
|
|
Keywords: Sickle cell anemia; Magnetic resonance imaging; Ferritin. |
|
|
Abstract: INTRODUCTION
In the setting of acute complications of sickle cell anemia (SCA), the decrease in hemoglobin levels may precipitate a cardio-pulmonary function decompensation, so erythrocytes transfusion become a therapeutic resource of great importance(1). With the frequent long term utilization of such resource, some complications such as iron overload may occur(2), as there is no active excretory mechanism for this micronutrient. Main manifestations of advanced iron overload include dysfunction of organs such as the liver, heart and endocrine organs. There are direct and indirect methods to estimate body iron levels(3). Serum ferritin test is the most available method and is easily reproducible, in spite of not providing a good specificity(3). Hepatic biopsy, in spite of being validated as a reference standard, is an invasive method and, therefore, involves risks inherent to the procedure(4). For these reasons, the possibility of replacing such a procedure by a noninvasive imaging method, in this case magnetic resonance imaging (MRI), is discussed(5). Several studies have described the utilization of MRI in the quantification of hepatic iron content, with variable results among them(59). Iron overload causes a decrease in the signal intensity of the hepatic parenchyma and the measurement of such an overload is possible since there is a correlation between the magnitude of signal reduction and the degree of iron excess(8). The present study is aimed at estimating the liver iron concentration by means of MRI in patients with SCA, and correlating iron overload biochemical and imaging markers in two different transfusion regimens. MATERIALS AND METHODS A cross-sectional study was developed with SCA patients regularly followed-up at a reference outpatient clinic in the state of Sergipe, Northeastern region of Brazil. In this region, there is a high prevalence of the hemoglobin S gene because of the ethnic composition of the population(10). For the purposes of the present study, eligible patients were those with SCA confirmed by means of hemoglobin electrophoresis and had already undergone blood transfusion. Patients with chronic hepatic disease not related to SCA were excluded. Thirty-two patients were sequentially selected and divided into two groups: the first group comprised patients undergoing sporadic blood transfusions due to complications (SG), and the second group, comprising patients undergoing regular blood transfusions (RG): 10 to 20 ml/kg administered monthly because their history of cerebrovascular accident. All the patients underwent clinical examination, laboratory tests (serum ferritin, serum iron, aminotransferase test and blood count) and MRI. Upper abdomen MRI scans were performed in a 1.5T Magnetom Avanto (Siemens; Munich, Germany) apparatus, without the use of contrast medium or sedation. The parameters utilized for the sequences acquisition were based on the protocol proposed by Alústiza et al.(8). The technique comprised five breath-hold GRE sequences (20 sections each), and one TSE trigger sequence (with respiratory synchronization and 35 sections), whose details are described on Table 1. 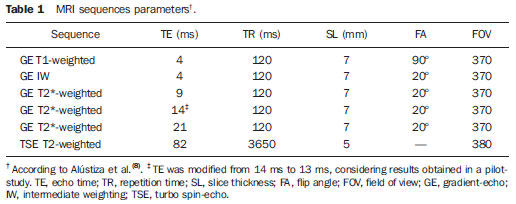 All the images were analyzed by a single experienced and duly trained radiologist. The regions of interest (ROIs), measuring at least 1 cm2, were positioned on three areas of the right hepatic lobe for measurement of the signal intensity and on two areas of the paravertebral musculature, one at right and the other at left, distant from the lung bases, hepatic vessels and from heterogeneous areas, in order to avoid artifacts. The arithmetic means of the three hepatic measurements and two muscular measurements were obtained, and the ratio between means was calculated, corresponding to the signal intensity ratio (SIR). The SIR was utilized, instead of the signal intensity in the liver alone, as the SIR considers the usual decrease in signal intensity that normally occurs as the echo time elapses, and because of the need for a reference tissue, the paravertebral musculature, that usually does not undergo iron deposition. Based on the SIR, the estimated hepatic iron concentration (EHIC) was obtained by means of the formula: e[5.808 (0.877 × T2*) (1.518 × PI)] where T2* is the SIR obtained on the sequence with TE = 14 ms, and PI is the SIR of the intermediate-weighted sequence. A previous study indicates that such formula shows excellent correlation between SIR and hepatic iron concentration measured in hepatic tissue obtained by means of biopsy (r = 0.937)(8). Means and standard deviations for quantitative variables and frequency distribution for proportional variables were utilized for data analysis. The patients were grouped according to two EHIC cut-off points and according to transfusional group (either SG or RG); the results were cross checked and compared with each other and between the groups. The groups comparison was made by means of the chi-square or Fishers tests (proportional variables and discrete quantitative variables) and by means of the t test for independent samples or the Kruskal-Wallis test (continuous quantitative variables), considering 5% (p < 0.05) as significance level. The correlations between SIR and serum iron and serum ferritin levels were evaluated by means of the Pearson correlation coefficient (r). The project of the present study was duly submitted and approved by the Committee for Ethics in Research of the responsible institution (CAE 0013.0.107.000-09), and the consent of the patients or parents/caregivers were expressed by means of the signature of a term of free and informed consent. RESULTS Thirty-two patients were submitted to MRI and had their serum ferritin levels measured. Among these patients, 23 (71.87%) were sporadically submitted to blood transfusion (SG). There was a subtle predominance of the male gender, with 19/32 patients (59.37%). The mean patients age was 14.21 ± 5.46 years. The mean serum ferritin value was 1,124.34 ± 644.26 µg/l, and serum iron value was 123.94 ± 45.12 µg/dl. The mean values for alanine transaminase and aspartate transaminase were 35.62 ± 27.82 U/l and 46.65 ± 23.12 U/l, respectively. The mean annual hemoglobin level was 8.20 ± 1.24 g/dl, and the total leukocyte count had a mean value of 12,009 ± 3,764/mm3 and platelets, 370,853 ± 134,101/mm3. The patients were stratified according to iron overload (according to EHIC calculated from the MRI results) at two cut-off points 40 µmol/g and 80 µmol/g and the clinical and laboratory predictors of iron overload were evaluated. Figure 1 shows liver MR images of a patient with EHIC of 20.7 µmol/g (A) and 262.2 µmol/g (B). 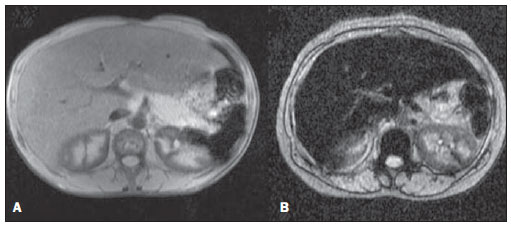 Figure 1. Abdominal MRI T2-weighted sequence* (TE = 13 ms). A: Patient with EHIC of 20.7 µmol/g. B: Patient with EHIC of 262.2 µmol/g. The noticeable difference in signal intensity between both livers is observed. Serum ferritin levels presented a mean value 58% higher in the group with iron overload, as 40 µmol/g was utilized as cut-off point, and 50% higher as the cut-off was 80 µmol/g, with statistically significant differences in both cases (p = 0.0001 and p = 0.0002, respectively). The transfusional group variable demonstrated to be predictive for overload, such an overload being greater in the group receiving regular transfusions (p = 0.0032 and p = 0.0234, respectively, for the EHIC cut-off points at 40 µmol/g and 80 µmol/g). The other variables did not present statistical significance (Table 2). 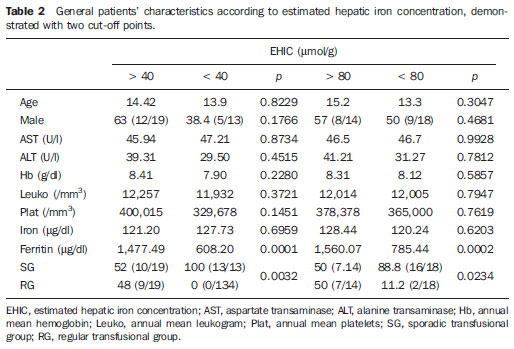 The correlation between the means of signal intensity ratios obtained from MRI and serum ferritin levels results, utilizing two reference groups as parameter (1,000 mg/dl and 500 mg/dl), was calculated and is shown on Table 3. It is observed that all the MRI sequences present lower signal intensity in the group with higher ferritin levels, for both cut-off points, a statistically significant result. Such a fact was not observed in cases where serum iron level was utilized as a reference. 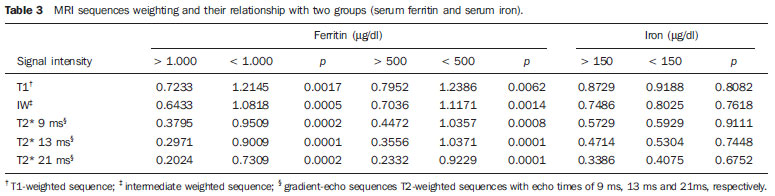 The comparison of transfusional groups was based on the clinical and laboratory variables. The values that presented statistical difference were SIR of the MRIs, EHIC and serum ferritin level. The remaining clinical and laboratory variables did not present any statistically significant difference (Table 4). 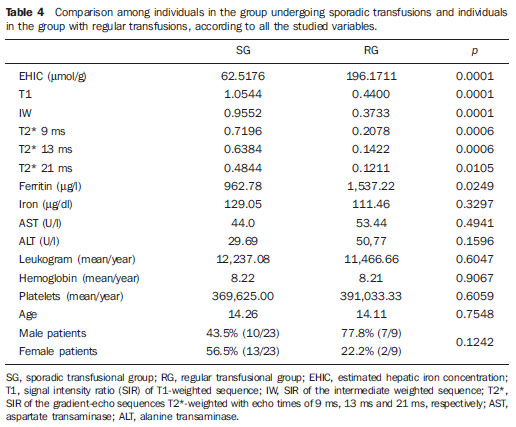 Figure 2 represents the correlations between EHIC and serum ferritin (A) and iron (B) levels. Serum ferritin levels did not present good linear correlation with EHIC, with a Pearson correlation coefficient equal to 0.44. The correlation with serum iron level was even worse than that of serum ferritin level (r = 0.01). 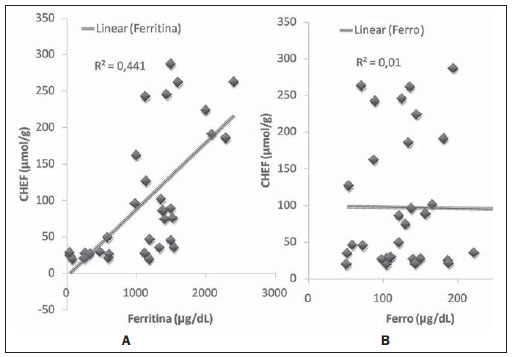 Figure 2. Correlation between EHIC and serum ferritin and iron levels. A: Correlation between serum ferritin levels and EHIC (r = 0.44). B: Correlation between serum iron levels and EHIC (r = 0.01). DISCUSSION An accurate and reproducible method for detection, evaluation and stratification of transfusion iron overload is a very useful tool in the clinical follow-up of patients with hemolytic anemia. The present study compared, in SCA patients, two strategies which are currently utilized for such purpose: serum ferritin test and MRI. The cut-off point for serum ferritin levels from which one can consider that tissue damage has already occurred is still to be determined: certainly, in cases where the values are > 1.000 mg/dl, the damages to organs and tissues have already occurred and some authors defend that the utilization of chelating agents be started at levels < 500 mg/dl(3). In individuals with no risk factors for iron overload, it is expected the EHIC are below 20 µmol/g. For those with chronic hemolytic anemia, tissue damage seems to occur between 40 µmol/g and 80 µmol/g(4,5). According to a previous study, serum ferritin levels do not present good correlation with the hepatic iron concentration(11). However, other sources indicate a linear correlation between serum ferritin levels and total estimated body iron by means of the evaluation of tissue iron concentration in liver biopsy specimen(3,9,12). However, it is known that the quantification of serum ferritin may be influenced by a number of factors, such as gender, infections, hepatopathies and cancer(3,13,14). For that reason, its serial measurement is more accurate than the isolated measurement(13,14). Angulo et al.(13) have not demonstrated linear relationship between mean serum ferritin levels in four years and the EHIC obtained by MRI, a finding that is in agreement with the present study. Based on the present results, it is possible to observe that the only clinical and laboratory predictive variables for transfusion iron overload are serum ferritin levels and transfusional group, which is in agreement with reports in the literature(3,12). Hepatic enzymes did not demonstrate to be a good iron overload indicator, which has already been previously observed(12). In the present study, no other variable could be utilized as an iron overload predictor, independently from the utilized cut-off point. It is important to highlight that the liver is the main iron storage organ, and the first to be injured, however the lesion of other organs, such as kidneys, pancreas, lungs, endocrine glands and heart, may decisively contribute to the death of patients with SCA(3,12,13,15,16). The long term effects of chronic iron overload have been more extensively described in patients with thalassemia, and SCA particularities may not allow the simple transfer of findings, among them the persistent activation of the inflammatory response cascade, as it modifies the serum ferritin concentration. Thus, in SCA patients, such variable is not a good indicator of iron overload in the organs. On the other hand, the serial imaging evaluation of a sentinel organ the liver may yield more reproducible data. By comparing the iron-overload intensity between the patient groups submitted to two different transfusion regimens, it is possible to conclude that the group undergoing regular transfusions is more subject to the overload complications as, on average, such group presents three times the EHIC as compared with the group undergoing sporadic transfusions. Such result is in agreement with data in the literature, as the number of transfusions is already a well established predictive factor for iron overload(3,12). The other variables that are predictive of overload (signal intensity and serum ferritin levels) were also altered in that group. Therefore, the RG patients must be closely followed-up particularly for the diagnosis and treatment of transfusional iron overload. The categorization of patients according to the transfusional profile and the confirmation that the group under regular transfusions presents more consistent signs of hepatic iron overload is justified because indicates a group of patients as priority candidates for MRI evaluation as soon as they receive the indication and start receiving regular transfusions. The periodicity of such evaluation could not be determined in the present study, because of its cross-sectional characteristic. This is a limitation of the study, which for the same reason did not sequentially evaluate the serum ferritin concentration. In spite of such fact, the present study results indicate that the assessment of hepatic iron overload by means of MRI in SCA patients submitted to regular erythrocyte transfusion may be useful to determining preemptive therapeutic interventions based on the utilization of iron chelating agents, with a view on the preservation of the functions of several organs and systems. CONCLUSION The EHIC obtained by means of MRI was efficient in the estimation of hepatic iron overload in SCA patients undergoing regular red blood cell transfusion regimen. Acknowledgements The authors wish to express their gratitude to Centro de Medicina Integrada de Sergipe Ltda. (Cemise) for the collaboration in the performance of MRI studies. REFERENCES 1. Naufel CCS, Braga JAP, Cançado RD, et al. Reação transfusional hiper-hemolítica em pacientes portadores de anemia falciforme: relato de dois casos. Rev Bras Hematol Hemoter. 2002;24:2929. 2. Wayne AS, Schoenike SE, Pegelow CH. Financial analysis of chronic transfusion for stroke prevention in sickle cell disease. Blood. 2000;96:236972. 3. Kohgo Y, Ikuta K, Ohtake T, et al. Body iron metabolism and pathophysiology of iron overload. Int J Hematol. 2008;88:715. 4. Gürkan E, Ergun Y, Zorludemir S, et al. Liver involvement in sickle cell disease. Turk J Gastroenterol. 2005;16:1948. 5. Angelucci E, Brittenham GM, McLaren CE, et al. Hepatic iron concentration and total body iron stores in thalassemia major. N Engl J Med. 2000;343:32731. 6. St Pierre TG, Clark PR, Chua-anusorn W, et al. Noninvasive measurement and imaging of liver iron concentrations using proton magnetic resonance. Blood. 2005;105:85561. 7. Wood JC, Henriquez C, Ghugre N, et al. MRI R2 and R2* mapping accurately estimates hepatic iron concentration in transfusion-dependent thalassemia and sickle cell disease patients. Blood. 2005;106:14605. 8. Alústiza JM, Artetxe J, Castiella A, et al. MR quantification of hepatic iron concentration. Radiology. 2004;230:47984. 9. Gandon Y, Olivié D, Guyader D, et al. Non-invasive assessment of hepatic iron stores by MRI. Lancet. 2004;363:35762. 10. Vivas WLP, Rebouças DS, Fabbro ALD, et al. Heterozigose para hemoglobinopatias em doadores de sangue do Centro de Hemoterapia de Sergipe. Rev Bras Hematol Hemoter. 2006;28:2847. 11. Harmatz P, Butensky E, Quirolo K, et al. Severity of iron overload in patients with sickle cell disease receiving chronic red blood cell transfusion therapy. Blood. 2000;96:769. 12. Cançado RD. Sobrecarga e quelação de ferro na anemia falciforme. Rev Bras Hematol Hemoter. 2007;29:31626. 13. Angulo IL, Covas DT, Carneiro AA, et al. Determination of iron-overload in thalassemia by hepatic MRI and ferritin. Rev Bras Hematol Hemoter. 2008;30:44952. 14. Vermylen C. What is new in iron overload? Eur J Pedriatr. 2008;167:37781. 15. Olivieri NF, Brittenham GM. Iron-chelating therapy and the treatment of thalassemia. Blood. 1997;89:73961. 16. Gomollón F, Gisbert JP. Anemia and digestive diseases: an update for the clinician. World J Gastroenterol. 2009;15:46156. 1. MDs, Universidade Federal de Sergipe (UFS), Aracaju, SE, Brazil. 2. Master in Health Sciences, MD, Radiologist, Assistant Professor at Department of Medicine, Universidade Federal de Sergipe (UFS), Aracaju, SE, Brazil. 3. PhD, Titular Professor, Head of Department of Medicine, Universidade Federal de Sergipe (UFS), Aracaju, SE, Brazil. 4. PhD, Associate Professor, Department of Medicine, Universidade Federal de Sergipe (UFS), Aracaju, SE, Brazil. Mailing Address: Dra. Rosana Cipolotti Avenida Beira Mar, 2016, ap. 402, Jardins Aracaju, SE, Brazil, 49025-040 E-mail: rosanaci@yahoo.com Received February 5, 2010. Accepted after revision May 17, 2011. Study developed at Universidade Federal de Sergipe (UFS), Aracaju, SE, Brazil. |
|
Av. Paulista, 37 - 7° andar - Conj. 71 - CEP 01311-902 - São Paulo - SP - Brazil - Phone: (11) 3372-4544 - Fax: (11) 3372-4554