Radiologia Brasileira - Publicação Científica Oficial do Colégio Brasileiro de Radiologia
AMB - Associação Médica Brasileira CNA - Comissão Nacional de Acreditação
 Vol. 50 nº 5 - Sep. / Oct. of 2017
|
ORIGINAL ARTICLE
|
|
Impact of the integration of proton magnetic resonance imaging spectroscopy to PI-RADS 2 for prediction of high grade and high stage prostate cancer |
|
|
Autho(rs): Michael S. Leapman1; Zhen J. Wang2; Spencer C. Behr2; John Kurhanewicz3; Ronald J. Zagoria2; Peter R. Carroll4; Antonio C. Westphalen5 |
|
|
Keywords: MRI; Spectroscopy; Diagnosis; Prostate cancer; Prostatectomy. |
|
|
Abstract: INTRODUCTION
Prostate cancer (PCa) is diagnosed in approximately 230,000 men in the United States each year(1), the majority of whom will possess favorable risk disease and in whom conservative approaches including active surveillance may be prudent(2). Multiparametric magnetic resonance imaging (mpMRI) of the prostate has gained considerable utilization in the setting of newly diagnosed disease to identify occult, higher-grade or stage elements missed by conventional biopsy(3,4). Moreover, when coupled with real time ultrasonography, fusion mpMRI biopsy has demonstrated superior PCa detection rates compared with traditional template guided biopsy(5). With growing integration of mpMRI as an adjunct diagnostic modality, the need to standardize acquisition protocols and study reporting is evident as it may facilitate benchmarks for consistency in both clinical care and research settings alike(6). The American College of Radiology, the AdMeTech Foundation, and the European Society of Urogenital Radiology have partnered and recently presented a new version of the Prostate Imaging Reporting and Data System (PI-RADS v2), which integrates results of T2-weighted (T2W), high b-value diffusion-weighted image (DWI), and dynamic contrast enhanced (DCE) MRI(7). Proton MR spectroscopic imaging (1H-MRSI), previously an optional tool, was not included in the current version of the document. 1H-MRSI has, though, been recognized as a useful non-invasive method for evaluating metabolic characteristics of prostatic lesions, yielding identifiable signatures that may allow for the discrimination of high-grade tumors(8). However, 1H-MRSI is susceptible to false positive related to choline contamination from the seminal vesicles or urethra(9), or by prostatitis(10). Furthermore, the ACRIN 6659 study that was published by Weinreb et al. found no added benefit for 1H-MRSI compared with T2W alone to localize PCa to the gland sextant(11). In this context, we sought to compare the diagnostic performance of PI-RADS v2 with or without 1H-MRSI for predicting PCa with dominant Gleason pattern ≥ 4 or non-organ confined disease at the time of surgery. MATERIALS AND METHODS The Institutional Review Board approved this retrospective single center study. Informed consent was prospectively obtained from all patients authorizing the use of clinical data in future studies. Consecutive subjects were identified through searches of our Urological Oncological Database, Prostate MR Imaging Database, and electronic medical records. Inclusion criteria: biopsy-proven PCa; 3-tesla endorectal prostate mpMRI, including 1H-MRSI; radical prostatectomy within six months of imaging; no treatments between imaging and surgery. Forty patients seen between January 2013 and December 2014 fulfilled these criteria, but one was excluded because of a hip replacement that distorted the 1H-MRSI data. Therefore, 39 men formed the study population. Patients were clinically risk stratified using the Cancer of the Prostate Risk Assessment score (CAPRA)(12). CAPRA is an easy to calculate validated nomogram that predicts outcomes across multiple treatment approaches and it predicts an individuals likelihood of metastasis, cancer-specific mortality, and overall mortality. The score is calculated using points assigned to: age at diagnosis, PSA at diagnosis, Gleason score of the biopsy, clinical stage and percent of biopsy cores involved with cancer. Three categories were assigned: low (scores 0-2), intermediate (scores 3-5), and high risk (scores 6-10). MRI technique Scans were acquired on a 3-tesla scanner (GE Healthcare, Waukesha, WI, USA) using the body coil for excitation and an endorectal coil (E-Coil; Medrad, Pittsburgh, PA, USA) filled with perfluorocarbon (Flutech_T14 TM; F2 Chemicals, UK) and a phased-array coil for reception. Images were post-processed to compensate for the reception profile of the endorectal coil(13). The protocol included: - Oblique axial T2W high-resolution 2D FSE MR images (thickness/gap = 3 mm/0 mm; TR/TE = 5600-7400 ms/96-114 ms; ETL = 16; FOV = 180 mm × 180 mm; reconstructed matrix 512 × 512; frequency direction AP, 1 NEX). Acquisition time = 4 min 1 s. - Axial CUBE T2W 3D FSE MR images (thickness/gap = 1.6 mm/0 mm; TR/TE = 2400 ms/142.4 ms; ETL = 90; FOV = 180 mm × 180 mm; 512 × 512 interpolated matrix in-plane and 2-fold along the craniocaudal axis; frequency direction AP, 2 NEX; flip angle = 90°; receiver bandwidth = 90.91 kHz). Coronal and sagittal reformats were generated. Acquisition time = 4 min 42 s. - Two 2D single-shot EPI SE high b-value DWI acquisitions (thickness/gap = 3 mm/0 mm; TR/TE = 4725 ms/minimum; FOV = 180 mm × 180 mm; 128 × 64; b-values 0 and 600 and 0 and 1350). Acquisition times = 3 min 52 s and 4 min 29 s. Two ADC maps were reconstructed from each acquisition. - Oblique axial T1-weighted 3D spoiled gradient echo dynamically contrast enhanced MR images (thickness/gap = 3 mm/0 mm; TR/TE = minimum/minimum; FOV = 260 mm × 260 mm; 192 × 128; 1 NEX; gadopentetate dimeglumine, 0.1 mmol/kg of body weight, at a rate of 3 cm3/s using a power injector, followed by a 20 cm3 saline bolus at the same rate, 5 min acquisition, temporal resolution = 10 s). Acquisition time = 4 min 58 s. - 3D 1H-MRSI using a water and lipid-suppressed double-spin-echo point resolved spectroscopy sequence (MLEV-PRESS) with spectral-spatial pulses for the two 180° excitation pulses, and outer-voxel saturation pulses (thickness/gap = 3 mm/0 mm; TR/TE = 2000 ms/85 ms; NEX = 1; phase encoding steps = 16 × 10 × 8; FOV = 86 × 54 × 43 mm3 yielding a nominal spatial resolution of 0.16 cm3). A PRESS volume was selected using the oblique axial T2W images that incorporated the entire prostate while minimizing inclusion of the rectum and peri-prostatic lipids. The PRESS volume was shimmed using an automated phase mapping algorithm, followed by manual shimming of the x, y and z gradients until a water line-width of ≤ 12 Hz was obtained. An interleaved flyback echo-planar spectroscopic readout with a spectral bandwidth of 1012 Hz was used in the left-right dimension. Acquisition time = 7 min 50 s. The 1H-MRSI data were processed using custom processing software(14). The raw data acquired with the modified PRESS incorporating the flyback echo-planar readout trajectory were reordered as previously described(15) and processed in the same manner as the conventional 4D 1H-MRSI dataset(14). The spectral data were apodized with a 2-Hz Lorentzian function in the frequency domain, with no filtering in the spatial dimensions. Data were Fourier transformed in the time domain and in three spatial domains. Spectral phase, baseline, and frequency corrections were iteratively made and metabolite peak areas calculated as previously described(14). The 3D 1H-MRSI spectral arrays and associated metabolite peak area ratios were overlaid on the corresponding transverse T2W images using the open-source spectral processing package SIVIC. - Axial T1-weighted FGRE MR images (thickness/gap = 4.2 mm/0 mm; TR/TE = 5.06 ms/2.46 ms; FOV = 240 mm × 240 mm; 192 × 128; NEX = 1). Acquisition time = 2 min 45 s. Image interpretation Two radiologists (8 and 5 years of experience with 1H-MRSI and 2 years of experience with PI-RADS v2, i.e. since its initial publication), unaware of the clinical and pathologic data, independently reviewed all scans on a PACS workstation (Impax; Agfa, Mortsel, Belgium) in a single session. To mimic clinical practice, the radiologist could review the T2W, DWI, and DCE sequences in any order, alone or in conjunction. The radiologists had no access to 1H-MRSI images at this stage. Up to four suspicious foci were identified and PI-RADS v2 scores assigned to each (Table 1)(7). 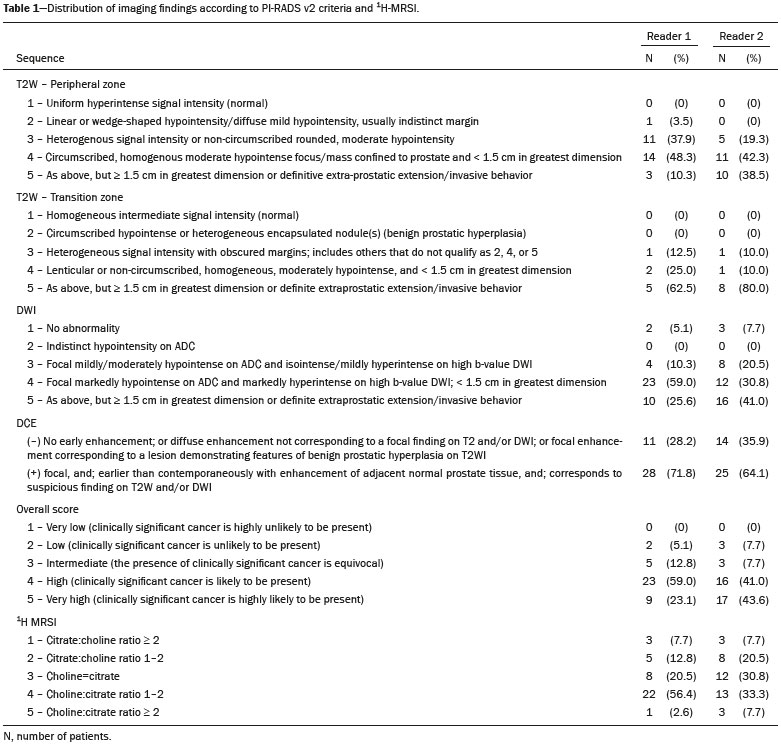 Next the radiologists reviewed the 3D spectral arrays to assign a 1H-MRSI score to all suspicious lesions previously assigned a PI-RADS v2 score, i.e. lesions that received a PI-RADS v2 score ranging from 3 to 5. All usable voxels were scored using the five-point scale based on the area ratio of the citrate and choline peaks (Table 1). Figure 1 shows a representative case. 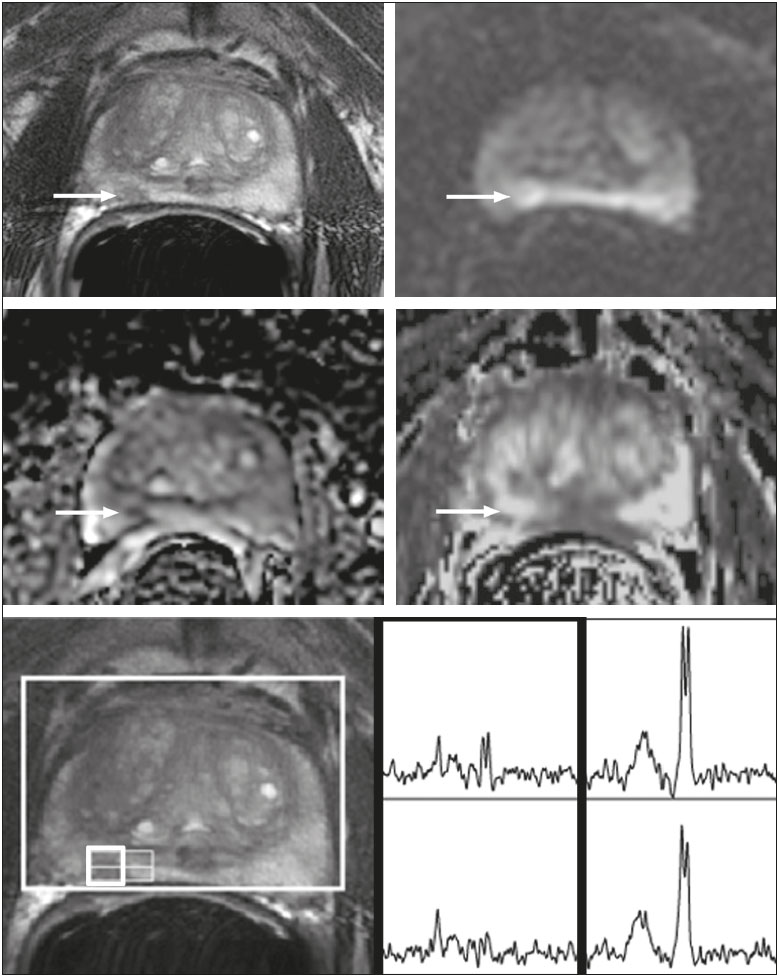 Figure 1. 73-year-old man with Gleason 4+3 prostate cancer in the right posterior peripheral zone on radical prostatectomy, corresponding to the findings on imaging (arrows). Reader 1 (and reader 2) characterized the lesion as T2 = 3 (4), DWI = 4 (4), DCE = negative (positive), and overall PI-RADS v2 score = 4 (4). Both readers assigned it a MRSI score of 4 (outlined voxels). Surgical technique and histologic evaluation Experienced urologists performed all radical prostatectomies. Pelvic lymph node dissection was performed based on pre-operative surgical risk. Prostatectomy specimens were marked with ink and fixed overnight in 10% buffered formalin. The glands were sectioned using whole-mount histology at 3 mm intervals in a plane perpendicular to the prostatic urethra. Experienced academic pathologists, unaware of imaging findings, reviewed the histological slides in all cases. The size, location, and Gleason score of all cancer foci seen in the prostate, and the presence, location, and extent of extra-prostatic disease were recorded. Statistical analysis The primary outcomes were the predictions of high-grade PCa, defined as Gleason score ≥ 4+3, and high-stage disease, defined as extra-prostatic extension (EPE) (≥ T3A) at radical prostatectomy on a per patient basis. In the event of multiple lesions, only the index lesion was considered for analyses. The index lesion was defined as the lesion with the highest overall PI-RADS score. If two or more lesions received the same score, the index lesion was the one associated with clear EPE. If none of the lesions demonstrated EPE, the index lesion was the largest one. We assessed the sensitivity, specificity, negative predictive value (NPV), positive predictive value (PPV), and accuracy of the overall PI-RADS v2 score and 1H-MRSI score assigned to suspicious lesions for the detection of these outcomes. For high-grade disease, the overall PI-RADS v2 scores 1 to 3 were considered a negative result. For non-organ confined PCa, the overall PI-RADS v2 scores 1 to 4 were considered a negative result. This was because the presence of EPE on mpMRI determines an overall PI-RADS v2 score of 5. For both analyses, 1H-MRSI was dichotomized as negative (score ≤ 3) or positive (score 4 or 5). We compared the areas under the receiver operating characteristic (ROC) curve of univariate logistic regression models that included the overall PI-RADS v2 score or 1H-MRSI score; and those to the area under the ROC curve derived from the multivariate models that included the overall PI-RADS v2 and 1H-MRSI scores. As mentioned above, if more than one lesion was suspected on mpMRI, only the index lesion was utilized in the analyses. Interobserver agreement of overall PI-RADS v2 and 1H-MRSI scores were calculated utilizing a weighted kappa score (weights = 1 / 1 - 1 / 0.25 - 0.25 - 1 / 0 - 0 - 0.75 - 1 / 0 - 0 - 0.5 - 0.75 - 1). All analyses were performed using Stata version 13.1 (College Station, TX). P values < 0.05 were considered statistically significant. RESULTS The median age was 65 years (interquartile range (IQR), 11). The median PSA at diagnosis was 6.8 ng/mL (IQR, 5.1). CAPRA classified 13 men (33.3%) with low, 21 (53.9%) with intermediate, and 5 (12.8%) with high clinical risk. Thirty-seven men (94.8%) had clinically organ-confined disease at diagnosis; and 28 (71.8%) had biopsy Gleason score ≤ 3+4. The complete clinical, demographic and pathologic characteristics are presented in Table 2. 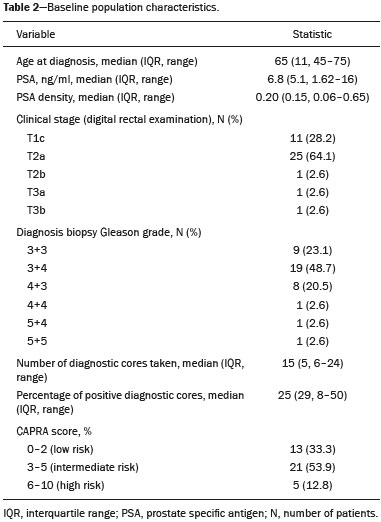 At prostatectomy, 5 men (12.8%) had Gleason score 3+3, 20 (51.3%) had Gleason score 3+4, 12 had Gleason score 4+3 (30.8%), 1 (2.6%) had Gleason score 4+4, and 1 (2.6%) had Gleason score 5+4. Disease was organ-confined (T2C or less) in 19 (48.7%). Twenty men (51.3%) had extra-prostatic extension. Table 1 reports the complete distribution of imaging findings for both readers; the weighted kappa of the overall PI-RADS v2 and of 1H-MRSI scores were 0.62 (95% confidence interval: 0.47-0.81; 88.8% agreement) and 0.46 (95% confidence interval: 0.22-0.70; 76.9% agreement), respectively. The specificity of 1H-MRSI (assigned to a suspicious lesion) to predict Gleason pattern ≥ 4+3 was higher than the specificity of the overall PI-RADS v2 score (56.0%, reader 1, and 68.0%, reader 2, versus 24%, both readers). For the detection of stage ≥ T3a, the use of 1H-MRSI scores to further characterize suspicious lesions led, for reader 1, to an increase in sensitivity (64% versus 20%) associated with a decrease in specificity (50% versus 71.4%). No clear differences were seen for reader 2. The performance characteristics are outlined in Table 3. 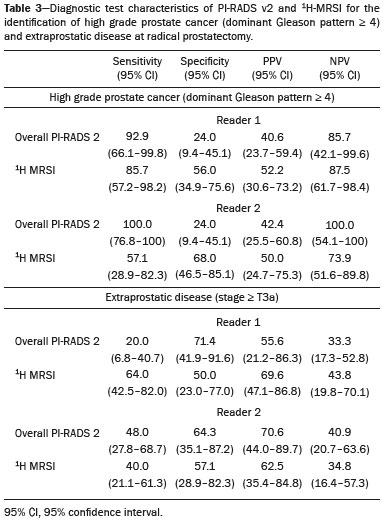 Table 4 details the AUCs for the prediction of Gleason pattern ≥ 4+3 and extraprostatic disease. These results are also illustrated in Figure 2. 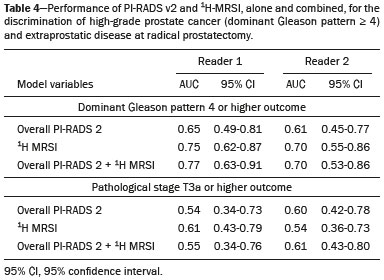 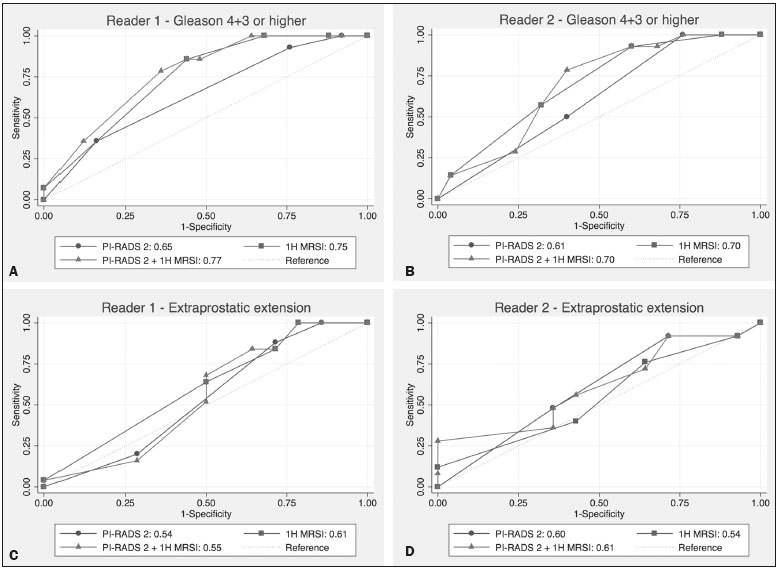 Figure 2. ROC curves for the prediction of pathological Gleason pattern 4 or higher disease (A,B) by the overall PI-RADS v2 score alone and PI-RADS v2 combined with 1H-MRSI. Images C and D depict the ROC curves for the prediction of non-organ confined disease (stage T3a or greater) by the same models. Analysis of the shape of the ROC curves shows that the addition of 1H-MRSI to PI-RADS v2 improves the prediction of high-grade PCa when lesions are characterized as PI-RADS v2 score 4. There were no statistically significant differences between the AUC of overall PI-RADS v2 (0.65, reader 1; and 0.61, reader 2) and 1H-MRSI (0.75, reader 1; and 0.70, reader 2) for either reader. The AUC of overall PI-RADS v2 combined with 1H-MRSI was significantly higher than the AUC of overall PI-RADS v2 alone for reader 1 (0.77; p = 0.04), but not for reader 2 (0.70; p = 0.21). For the discrimination of stage ≥ T3a, there were no statistically significant differences between the AUC of overall PI-RADS v2 (0.54, reader 1; and 0.60, reader 2), 1H-MRSI (0.61, reader 1; and 0.54, reader 2), and their combination (0.55, reader 1; and 0.61, reader 2) for either reader. DISCUSSION Our results suggest that the addition of 1H-MRSI to PI-RADS v2 might improve the detection of PCa with Gleason pattern ≥ 4+3, in particular of PI-RADS v2 score 4 lesions; however, it does not seem to increase the detection of high stage (≥ T3a) disease. Different from its initial version, PI-RADS v2 does not include 1H-MRSI. Yet, the PI-RADS Steering Committee encourages the continued development of promising MRI methodologies, including 1H-MRSI(16), and state that these technologies will be considered for inclusion in future versions, pending new data. While the PI-RADS v2 document does not provide specific reasons for not including 1H-MRSI, it is known that it is a complex technique with limited acceptance outside specialized centers due to its long acquisition time, need for local expertise, and general reliance on endorectal coil imaging. Yet, 1H-MRSI warrants continue attention; new hardware and software developments may make it more manageable. Based on previous studies, 1H-MRSI improves tumor localization(17,18), volume estimation(19,20), staging(21), tissue characterization(22), and identification of recurrent disease after therapy(23,24). A multicenter study showed that positive MR spectroscopy findings are likely to reflect higher tumor grade and/or volume(25). These studies, though, do have limitations, and there are, also, those with less encouraging results; the ACRIN study published in 2009, for example, showed no difference of accuracy when comparing combined T2W and 1H-MRSI and T2W alone(11). Our results show that the overall PI-RADS v2 score is very sensitive to detect Gleason pattern ≥ 4+3, but its specificity is very low. This suggests PI-RADS v2 is a good option to detect the disease, but not necessarily to characterize it. The use of 1H-MRSI, however, led to a 50% increase in specificity, and might at least in some cases help to identify men with high-grade PCa. Our results showed this is particularly true when a lesion receives a PI-RADS v2 score of 4. These results are aligned to those of Giusti et al., who showed that metabolic ratios correlate with Gleason scores(26), and they are similar to those of a meta-analysis in which 1H-MRSI had a higher specificity than T2W and increased the specificity of the combination of T2W and DWI(18). While the comparison of overall AUCs (i.e. summary of data for all lesions) found an improvement of discrimination between men with and without PCa Gleason pattern ≥ 4+3 using the combined PI-RADS v2 and 1H-MRSI for one reader only, the assessment of the shape of the curves shows a clear separation between the lines of the ROC curves of PI-RADS v2 alone and PI-RADS v2 combined with1H-MRSI at the segment that includes only PI-RADS v2 score 4 lesions for both readers. It is possible that this discrepancy in results is due to differences in readers experience. 1H-MRSI is a complex technique and interpretation can be challenging. It is important to make note of this fact, as these same challenges are likely to be found at other sites that lack radiologist with experience with 1H-MRSI. The metabolic nature of 1H-MRSI might explain why it did improve the detection of EPE, as EPE is typically detected on anatomical images. The overall PI-RADS v2 score, however, does include an anatomical assessment. Furthermore, both readers assigned an overall PI-RADS score of 4 or 5 to more than 80% of these suspicious lesions, and an overall PI-RADS v2 score of 5, at least in some instances, characterizes definite EPE(16). An increase in specificity after utilizing 1H-MRSI might, therefore, not have been expected. Similarly, because 1H-MRSI was applied after the detection of a suspicious lesion using PI-RADS v2, its sensitivity is a direct reflection of this initial detection. Accordingly, it would be expected that positive 1H-MRSI results would have a greater impact on lower overall PI-RADS v2 scores. In this study we opted for analyzing only the index lesion, less than 20% of which received a score of 3, likely explaining the lack of benefit of 1H-MRSI. It remains, thus, unknown if 1H-MRSI would have affected cases presenting with these indeterminate lesions. We did not find other studies evaluating the incorporation 1H-MRSI to PI-RADS v2, but a few authors tested it with its previous version with various results. The studies of Khalifa et al.(27) and Panebianco et al.(28) suggested 1H-MRSI improved characterization of PCa and support our results. Yet, the results of Platzek et al.(29) and, more recently, Polanec et al.(30) found that 1H-MRSI did not increase the detection and nor improved the grading of PCa. While several possible explanations exist for these discrepancies, the exercise of explaining them is likely not warranted, as the first version of PI-RADS is quite different from PI-RADS v2 and should no longer be utilized. More important, perhaps, is to recognize that considerable interest exists in optimizing the identification high grade or stage disease among men with clinically localized PCa as such determinations may improve management decisions. And that other imaging techniques, including 1H-MRSI, may be helpful. This study has limitations. First, this was a retrospective study with the limitations inherent to this type of design. The population studied was highly selected and included only men who had endorectal mpMRI and radical prostatectomy. We, therefore, probably incurred selection bias and our patients may not fully represent all men with PCa. This is illustrated by the fact most of our lesions were characterized as PI-RADS v2 4 and 5, as men with lower scores are less likely to have cancer and to undergo surgery. However, we considered the need for an adequate standard of reference more important than the limited generalizability. One possible option to prostatectomy is MR-guided biopsy, which can be performed in-bore or by fusion with ultrasound. Accordingly, some of our results, in particular the positive and negative predictive values, do not apply to all men with suspected PCa nor to all men who are under active surveillance and typically have low-grade low-volume disease. Second, we examined endpoints of high-grade and/or non-organ confined disease, but not more distant oncologic endpoints including biochemical recurrence or metastatic progression. Prospective studies with extended follow up may be warranted to definitively evaluate the role of 1H-MRSI in improved delineation of PCa outcomes. Third, PI-RADS was designed with the intent to improve the detection of tumors with Gleason score ≥ 3+4, and not ≥ 4+3 as we proposed. This could, perhaps, explain the low specificity of PI-RADS v2 found in this study. More important, though, is that we may have overestimated the diagnostic performance of both PI-RADS v2 and 1H-MRSI due to spectrum bias. Spectrum bias refers to the fact that it is usually easier to detect advanced disease than early-stage disease, as subtle abnormalities can be hard to distinguish from normal findings. This typically leads to a higher diagnostic accuracy when a study includes in a population with advanced disease than when the subjects have less severe disease. We opted for characterizing as high-grade tumors only tumors with Gleason score ≥ 4+3 because many institutions consider men with Gleason 3+4 as candidates for active surveillance, while a Gleason score ≥ 4+3 is universally considered an indication for definitive therapy. In summary, 1H-MRSI might improve the discrimination of pathological Gleason score ≥ 4+3 when added to the PI-RADS v2, in particular for lesions that receive a score of 4, but it does not affect the prediction of PCa stage ≥ T3a. REFERENCES 1. Siegel RL, Miller KD, Jemal A. Cancer statistics, 2015. CA Cancer J Clin. 2015;65:5-29. 2. Glass AS, Cowan JE, Fuldeore MJ, et al. Patient demographics, quality of life, and disease features of men with newly diagnosed prostate cancer: trends in the PSA era. Urology. 2013;82:60-5. 3. Wysock JS, Rosenkrantz AB, Huang WC, et al. A prospective, blinded comparison of magnetic resonance (MR) imaging-ultrasound fusion and visual estimation in the performance of MR-targeted prostate biopsy: the PROFUS trial. Eur Urol. 2014;66:343-51. 4. Pokorny MR, de Rooij M, Duncan E, et al. Prospective study of diagnostic accuracy comparing prostate cancer detection by transrectal ultrasound-guided biopsy versus magnetic resonance (MR) imaging with subsequent MR-guided biopsy in men without previous prostate biopsies. Eur Urol. 2014;66:22-9. 5. Siddiqui MM, Rais-Bahrami S, Turkbey B, et al. Comparison of MR/ultrasound fusion-guided biopsy with ultrasound-guided biopsy for the diagnosis of prostate cancer. JAMA. 2015;313:390-7. 6. Hamoen EH, de Rooij M, Witjes JA, et al. Use of the Prostate Imaging Reporting and Data System (PI-RADS) for prostate cancer detection with multiparametric magnetic resonance imaging: a diagnostic meta-analysis. Eur Urol. 2015;67:1112-21. 7. Weinreb JC, Barentsz JO, Choyke PL, et al. PI-RADS Prostate Imaging - Reporting and Data System: 2015, Version 2. Eur Urol. 2016;69:16-40. 8. Rais-Bahrami S, Siddiqui MM, Turkbey B, et al. Utility of multiparametric magnetic resonance imaging suspicion levels for detecting prostate cancer. J Urol. 2013;190:1721-7. 9. Verma S, Rajesh A, Futterer JJ, et al. Prostate MRI and 3D MR spectroscopy: how we do it. AJR Am J Roentgenol. 2010;194:1414-26. 10. Sciarra A, Panebianco V, Ciccariello M, et al. Magnetic resonance spectroscopic imaging (1H-MRSI) and dynamic contrast-enhanced magnetic resonance (DCE-MRI): pattern changes from inflammation to prostate cancer. Cancer Invest. 2010;28:424-32. 11. Weinreb JC, Blume JD, Coakley FV, et al. Prostate cancer: sextant localization at MR imaging and MR spectroscopic imaging before prostatectomy-results of ACRIN prospective multi-institutional clinicopathologic study. Radiology. 2009;251:122-33. 12. Cooperberg MR, Pasta DJ, Elkin EP, et al. The University of California, San Francisco Cancer of the Prostate Risk Assessment score: a straightforward and reliable preoperative predictor of disease recurrence after radical prostatectomy. J Urol. 2005;173:1938-42. 13. Noworolski SM, Reed GD, Kurhanewicz J, et al. Post-processing correction of the endorectal coil reception effects in MR spectroscopic imaging of the prostate. J Magn Reson Imaging. 2010;32:654-62. 14. Nelson SJ. Analysis of volume MRI and MR spectroscopic imaging data for the evaluation of patients with brain tumors. Magn Reson Med. 2001;46:228-39. 15. Chen AP, Cunningham CH, Ozturk-Isik E, et al. High-speed 3T MR spectroscopic imaging of prostate with flyback echo-planar encoding. J Magn Reson Imaging. 2007;25:1288-92. 16. American College of Radiology. MR Prostate Imaging Reporting and Data System version 2.0. [cited 2016 Mar 15]. Available from: www.acr.org/Quality-Safety/Resources/PIRADS. 17. Umbehr M, Bachmann LM, Held U, et al. Combined magnetic resonance imaging and magnetic resonance spectroscopy imaging in the diagnosis of prostate cancer: a systematic review and meta-analysis. Eur Urol. 2009;55:575-90. 18. Zhang ZX, Yang J, Zhang CZ, et al. The value of magnetic resonance imaging in the detection of prostate cancer in patients with previous negative biopsies and elevated prostate-specific antigen levels: a meta-analysis. Acad Radiol. 2014;21:578-89. 19. Anwar M, Westphalen AC, Jung AJ, et al. Role of endorectal MR imaging and MR spectroscopic imaging in defining treatable intraprostatic tumor foci in prostate cancer: quantitative analysis of imaging contour compared to whole-mount histopathology. Radiother Oncol. 2014;110:303-8. 20. Chang S, Westphalen AC, Jha P, et al. Endorectal MRI and MR spectroscopic imaging of prostate cancer: developing selection criteria for MR-guided focused ultrasound surgery-preliminary experience. AJR Am J Roentgenol. 2011;196:A31-A35. 21. Yu K, Scheidler J, Hricak H, et al. Prostate cancer: prediction of extracapsular extension with endorectal MR imaging and three-dimensional proton MR spectroscopic imaging. Radiology. 1999;213:481-8. 22. Jung JA, Coakley FV, Vigneron DB, et al. Prostate depiction at endorectal MR spectroscopic imaging: investigation of a standardized evaluation system. Radiology. 2004;233:701-8. 23. Arrayeh E, Westphalen AC, Kurhanewicz J, et al. Does local recurrence of prostate cancer after radiation therapy occur at the site of primary tumor? Results of a longitudinal MRI and MRSI study. Int J Radiat Oncol Biol Phys. 2012;82:e787-93. 24. Westphalen AC, Coakley FV, Roach M 3rd, et al. Locally recurrent prostate cancer after external beam radiation therapy: diagnostic performance of 1.5-T endorectal MR imaging and MR spectroscopic imaging for detection. Radiology. 2010;256:485-92. 25. Shukla-Dave A, Hricak H, Akin O, et al. Preoperative nomograms incorporating magnetic resonance imaging and spectroscopy for prediction of insignificant prostate cancer. BJU Int. 2012;109:1315-22. 26. Giusti S, Caramella D, Fruzzetti E, et al. Peripheral zone prostate cancer. Pre-treatment evaluation with MR and 3D 1H MR spectroscopic imaging: correlation with pathologic findings. Abdom Imaging. 2010;35:757-63. 27. Khalifa MHK, Hafez A, Elnoueam K, et al. Multi-parameteric MRI and PI-RADS scoring system: our new inception in clinical practice with evaluation of the diagnostic performance of different score combinations. Poster No. C-0590. European Congress of Radiology 2015. 4-8 March 2015. Vien, Austria. 28. Panebianco V, Barchetti F, Manenti G, et al. MR imaging-guided prostate biopsy: technical features and preliminary results. Radiol Med. 2015;120:571-8. 29. Platzek I, Borkowetz A, Toma M, et al. Multiparametric prostate magnetic resonance imaging at 3 T: failure of magnetic resonance spectroscopy to provide added value. J Comput Assist Tomogr. 2015;39:674-80. 30. Polanec SH, Pinker-Domenig K, Brader P, et al. Multiparametric MRI of the prostate at 3 T: limited value of 3D (1)H-MR spectroscopy as a fourth parameter. World J Urol. 2016;34:649-56. 1. MD, Department of Urology, University of California San Francisco, San Francisco, CA, USA 2. MD, Department of Radiology and Biomedical Imaging, University of California San Francisco, San Francisco, CA, USA 3. PhD, Department of Radiology and Biomedical Imaging, University of California San Francisco, San Francisco, CA, USA 4. MPH, MD, Department of Urology, University of California San Francisco, San Francisco, CA, USA 5. MD, PhD, Department of Radiology and Biomedical Imaging and Department of Urology, University of California San Francisco, San Francisco, CA, USA Mailing address: Antonio C. Westphalen, MD, PhD Department of Radiology and Biomedical Imaging, University of California San Francisco 505 Parnassus Avenue, M-372 San Francisco, CA, 94143, USA E-mail: antonio.westphalen@ucsf.edu Received July 7, 2016. Accepted after revision November 3, 2016. Study conducted in the Department of Radiology and Biomedical Imaging and in the Department of Urology, University of California San Francisco, San Francisco, CA, USA. This study was partly supported by NIH Grant R01CA137207. |
|
Av. Paulista, 37 - 7° andar - Conj. 71 - CEP 01311-902 - São Paulo - SP - Brazil - Phone: (11) 3372-4544 - Fax: (11) 3372-4554