Radiologia Brasileira - Publicação Científica Oficial do Colégio Brasileiro de Radiologia
AMB - Associação Médica Brasileira CNA - Comissão Nacional de Acreditação
 Vol. 55 nº 4 - July / Aug. of 2022
|
ORIGINAL ARTICLE
|
|
Quantitative assessment of emphysema and bronchial wall thickness in patients with stable chronic obstructive pulmonary disease: comparison between the eosinophilic and non-eosinophilic phenotypes |
|
|
Autho(rs): Rebecca Saray Marchesini Stivala; Lêda Maria Rabelob; Giovanna Lemes Leãoc; Diogo Drevenowskid; Joel Serafinie; Vítor Lopes Galvão Vieiraf; Dante Luiz Escuissatog |
|
|
Keywords: Pulmonary disease, chronic obstructive; Eosinophils; Tomography, X-ray computed. |
|
|
Abstract: INTRODUCTION
Chronic obstructive pulmonary disease (COPD) is characterized by persistent lung airflow limitation that is not completely reversible, being diagnosed on the basis of spirometric criteria and a history of exposure to harmful particles or gases(1). The diagnostic criteria have recently been a topic of discussion, and computed tomography (CT) of the chest is considered important to complete the tetrad for the diagnosis of COPD(2): clinical manifestations; exposure; spirometric parameters; and CT findings. The current treatment for COPD is based on the use of bronchodilators and has the objective of decreasing lung hyperinflation, relieving symptoms, and reducing exacerbations(1,3). There is a need to identify a biological marker that is able to predict the response to inhaled corticosteroids (ICS), which could inform the decision-making process regarding the timing of the initiation of ICS treatment in COPD patients with exacerbations, as well as regarding the discontinuation of ICS treatment when its side effects outweigh its benefits. The eosinophil count in peripheral blood is a good indicator of the need for corticosteroid therapy(46), having recently become an important biological marker for therapeutic decision-making. The 2019 Global Initiative for Chronic Obstructive Lung Disease (GOLD) report considers an eosinophil count ≥ 300 cells/µL in the first assessment of patients with COPD to be a criterion for the initiation of ICS(1). It remains unclear whether eosinophilic inflammation of the airways, present in approximately 1040% of patients with COPD(7), plays a role in bronchial remodeling, which manifests as bronchial wall thickening on chest CT. It is also unknown if there is a direct relationship between eosinophilia and the amount of emphysema observed on imaging. Although COPD is a heterogeneous disease with an idiosyncratic progression, there have been few studies evaluating the CT profile of patients with eosinophilic COPD. Therefore, the objective of this study was to perform a quantitative assessment of the CT findings of emphysema and bronchial wall thickening in patients with stable COPD, as well as to evaluate their association with peripheral eosinophilia, defined as an eosinophil count ≥ 300 cells/µL. MATERIALS AND METHODS This was a retrospective, cross-sectional observational study. Using the 2019 the GOLD report criteria, we assessed adult patients with COPD followed at the Pulmonology Outpatient Clinic of the Complexo Hospital de Clínicas da Universidade Federal do Paraná (CHC-UFPR, Federal University of Paraná Hospital de Clínicas Complex), in the city of Curitiba, Brazil. The CHC-UFPR Human Research Ethics Committee approved the study (Reference no. 01372618.0.0000.0096). All of the patients were clinically stable. Exacerbation profiles were determined with the ABCD assessment tool, which was developed by the GOLD as a means of assessing the stage and severity of COPD(1). We evaluated the eosinophil counts in peripheral blood measured in the most recent complete blood count. We also analyzed the most recent chest CT scan performed at the CHC-UFPR. Patients with asthma, asthma-COPD overlap syndrome, or alpha-1 antitrypsin deficiency were excluded. The study was conducted from 1 August, 2018 to 31 July, 2019, and the patients were divided into two groups according to the absolute number of eosinophils in their complete blood count: eosinophilic (≥ 300 cells/µL); and non-eosinophilic (< 300 cells/µL). The cutoff value to characterize the eosinophilic phenotype was 300 cells/µL. The CT data were collected from high-resolution chest CT scans on file in the Picture Archiving and Communication System of the CHC-UFPR Radiology Department and analyzed at the Diagnóstico Avançado por Imagem clinic, also in the city of Curitiba. The chest CT scans were obtained in a 64-slice scanner (Aquillion; Toshiba Medical Systems, Tokyo, Japan), during full inspiration, at a tube voltage of 120 kVp and a tube current of 120 mAs. The images were reconstructed by using a soft-tissue convolution kernel (FC13) and 1-mm isotropic voxels. In all of the scans, we analyzed the presence of motion artifacts and whether or not all lung segments were included. Qualitative image processing was performed on a standard workstation (AW server; GE Healthcare, Milwaukee, WI, USA) with thoracic volume computer assisted reading software (GE Healthcare), which allowed automated lung segmentation and automated measurement of bronchial wall thickness. After the lung had been segmented, we quantified the degree of emphysema by determining the attenuation valuesin Hounsfield units (HU), calculating the proportion of areas with attenuation below a predetermined threshold (Figure 1). As in several other studies, the threshold selected for the present study was −950 HU, any area with an attenuation value below that threshold being categorized as emphysematous(8,9). We also calculated the lung volumes and proportional areas of emphysema. 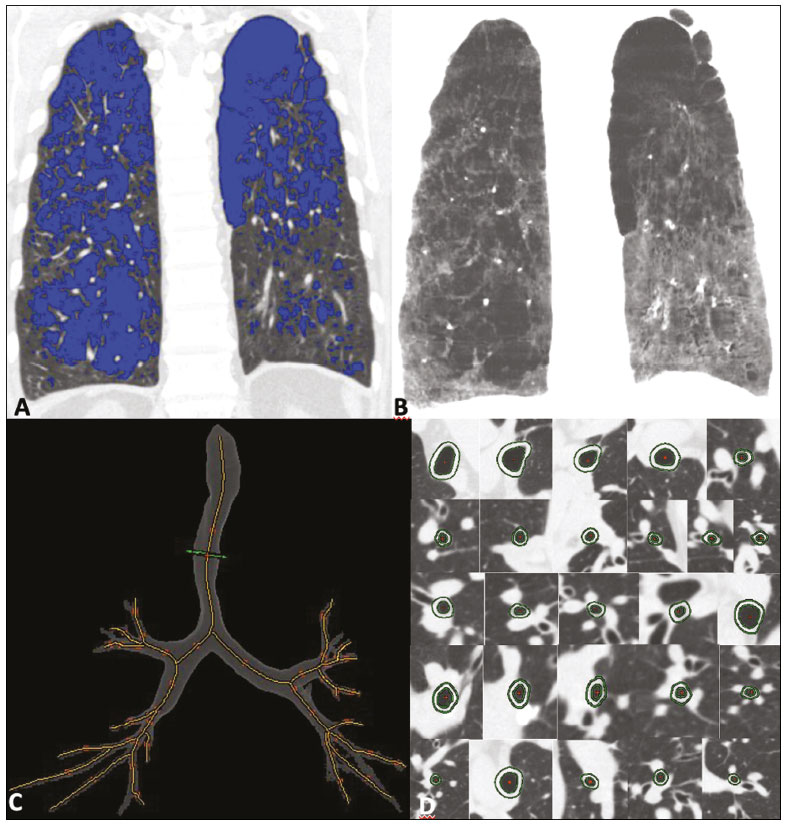 Figure 1. A,B: Quantification of emphysema on chest CT scans. A: Coronal image showing blue areas corresponding to regions with less than −950 HU (emphysema). B: Coronal image with minimum intensity projection reconstruction showing extensive areas of emphysema with low attenuation. C,D: Quantification of tracheal and bronchial wall thickness. C: Three-dimensional reformatting with lines on the central regions of the bronchial segments analyzed. D: Example of transversal plane measurement for each of the 27 segments (trachea, plus first, second, and third generation bronchi). The airways were analyzed by semi-automated segmentation(10). After selecting the bronchus for analysis, the software reconstructed and rectified the airway, enabling the measurement of the wall thickness (Figure 1). The selection included measurements of the following: trachea; main bronchi; upper lobe bronchi; left lower lobe bronchus; right, lower, and middle bronchi; and segmental bronchi (three right upper lobe segments, two middle lobe segments, four left upper lobe segments, five right lower lobe segments, and four left lower lobe segments). In each of those locations, the measurements were made in the middle third of the segment of interest or the spot at which the automated segmentation had shown the wall thickness to be most representative of the mean wall thickness, as determined by a radiologist with five years of experience in thoracic radiology. In all 110 patients, the bronchi were scanned down to the third generation. Scans with segmentation or quantification errors, as determined by the radiologist, were excluded from the analysis. Statistical analysis Continuous variables are presented as means and standard deviations (SDs), with minimum and maximum values, whereas categorical variables are presented as absolute and relative frequencies. For between-group comparisons of categorical variables, Fishers exact test or the chi-square test was used. For continuous variables, the groups were compared by using the Students t-test for independent samples or the nonparametric Mann-Whitney U test. The Kolmogorov-Smirnov test was used in order to assess the normality of the continuous variables. Values of p < 0.05 were considered indicative of statistical significance. Statistical analyses were performed with the IBM SPSS Statistics software package, version 20.0 (IBM Corp., Armonk, NY, USA), as described by Pagano et al.(11). RESULTS Of the 386 patients with COPD followed during the study period, 110 (28.5%) met the inclusion criteria. Among those 110 patients, the eosinophil count in peripheral blood was ≥ 300 cells/μL in 28 (25.5%) and < 300 cells/μL in 82 (74.5%), those patients therefore composing the eosinophilic and non-eosinophilic groups, respectively. The demographic, functional, and clinical characteristics of the patients were similar between the two groups (Tables 1 and 2), demonstrating that the sample was homogeneous. As assessed with the ABCD tool(1), 36 (43.9%) of the 82 patients in the non-eosinophilic group had an exacerbation profile, compared with 10 (35.7%) of the 28 patients in the eosinophilic group. Of the patients in the non-eosinophilic group, 52 (63.4%) used ICS, as did 19 (67.9%) of those in the eosinophilic group. 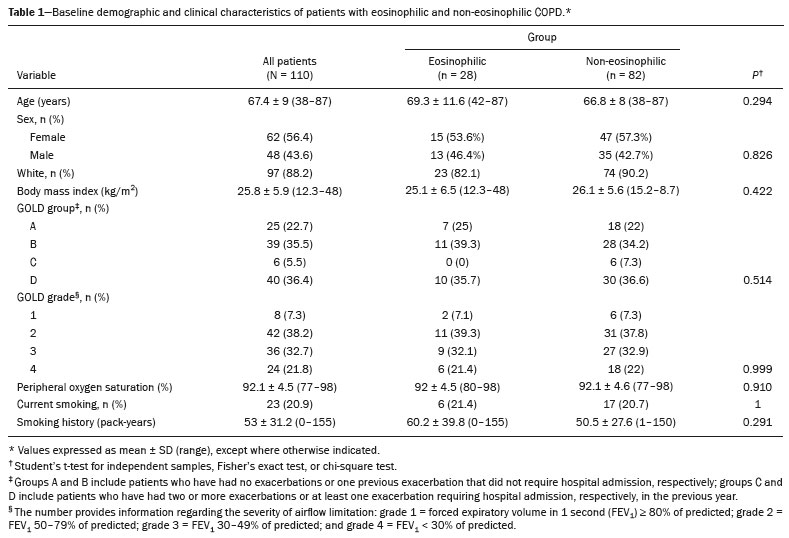 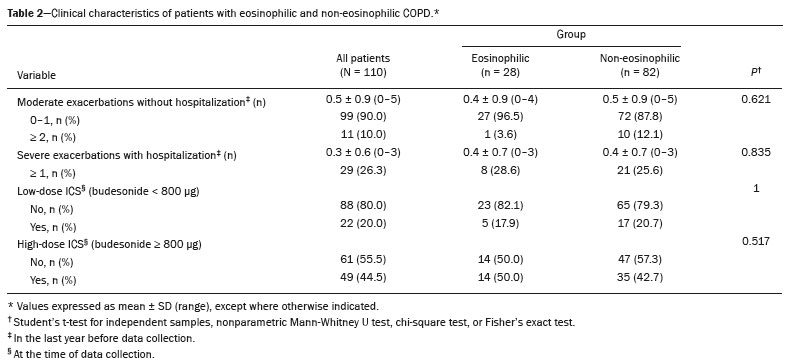 For the analysis of bronchial wall thickness, the images obtained for nine patients could not be evaluated, because of errors in airway segmentation, three patients having been excluded from the analysis because of difficulties in measuring the thickness of some segmental bronchi, due to beam hardening artifacts or anatomical variations. Therefore, data regarding the thickness of the trachea, main bronchi, and segmental bronchi were available for only 101 patients. Tables 3 and 4 show those data for the right and left lungs, respectively. There was no statistically significant difference between the two groups in terms of the mean thickness of any given bronchial wall segment or the overall mean bronchial wall thickness (p > 0.05 for all). 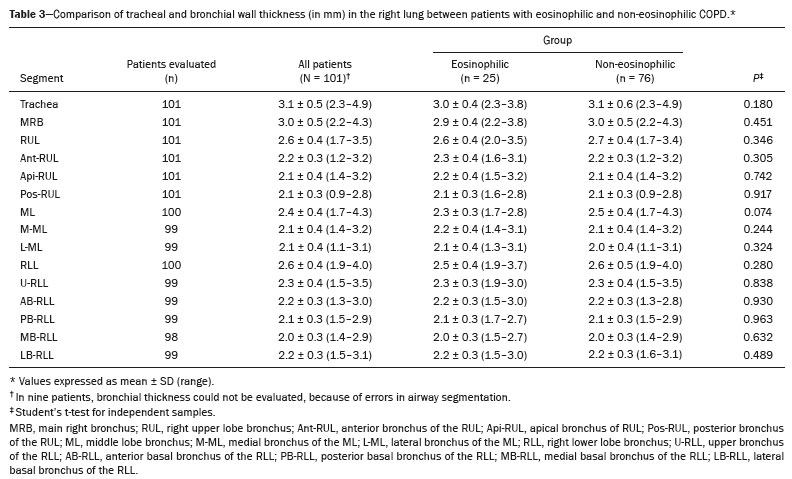 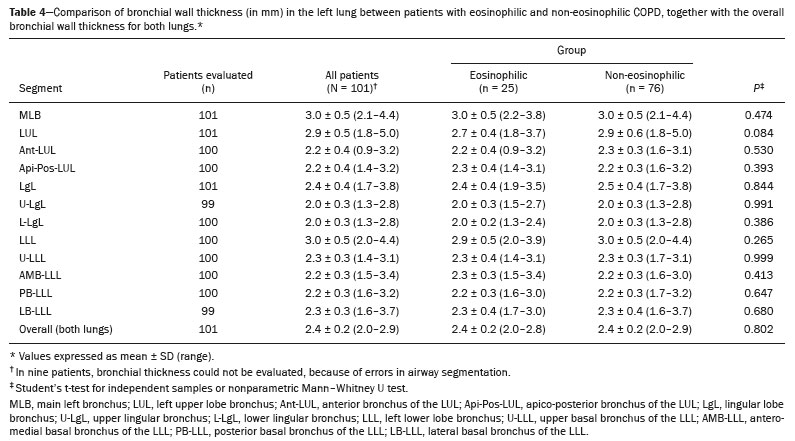 Table 5 shows the lung volumes and proportional areas of emphysema, by group. In two patients, the quantitative analysis of emphysema was not possible, because of architectural distortion of the lung parenchyma. Therefore, data regarding the volume and proportional area of emphysema were available for only 108 patients. Nevertheless, there was no statistically significant difference between the two groups in terms of the mean lung volumes (p > 0.05 for all). 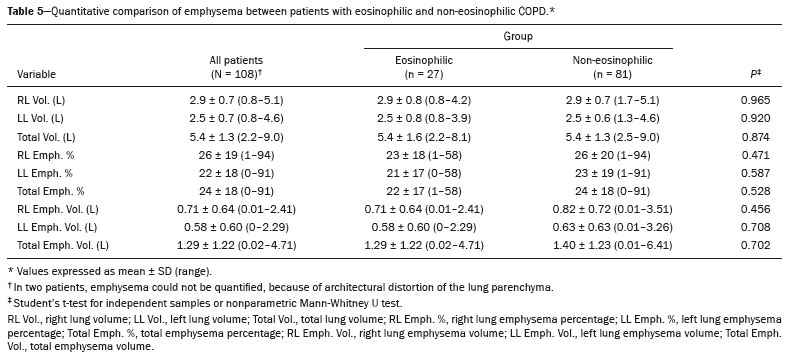 DISCUSSION The eosinophil count has been increasingly considered to be a biological marker of COPD, especially after its inclusion in the algorithm of the 2019 GOLD treatment guidelines. The eosinophil count in peripheral blood became a criterion for the initiation and discontinuation of ICS therapy in patients with stable COPD, as well as for therapeutic management of COPD with exacerbations, as recommended in the 2019 GOLD report(1). That has been supported by previous studies such as the Withdrawal of Inhaled Steroids During Optimized Bronchodilator Management study(12), in which it was observed that the discontinuation of ICS therapy in patients with an eosinophil count ≥ 300 cells/µL increased the risk of exacerbation(13). However, other significant studies, such as that conducted by Ferguson et al.(14), used an eosinophil count cutoff of 150 cells/µL, which was found to have a positive impact on ICS therapy in patients with eosinophilic COPD(15). In patients with COPD, the pathophysiology of airway inflammation is predominantly neutrophilic. Nevertheless, up to one third of the patients present with eosinophilic airway inflammation. That profile is seen more commonly in patients in whom the predominant manifestation is chronic bronchitis than in those in whom it is emphysema(16). Eosinophils stimulate the release of cytokines, chemokines, and leukotrienes that could be responsible for bronchial remodeling, given that, in patients with asthma, there is a relationship between eosinophilia and bronchial thickening(17). Our finding that there was no association between the eosinophil count in peripheral blood and bronchial wall thickening could be due to the fact that the frequency of ICS use was high in our sample: 67.9% in the eosinophilic group and 63.4% in the non-eosinophilic group. The fact that 43.9% of the patients in our non-eosinophilic group had an exacerbation profile, as did 35.7% of those in our eosinophilic group, together with the fact that the frequency of ICS use was high in both groups, could explain our difficulty in establishing a significant difference between the two groups in terms of the chest CT findings. Our study has some limitations. First, because of the retrospective study design, the data were collected exclusively from medical records. In addition, the data were obtained by convenience sampling. Although we were careful in selecting the blood counts obtained closest to the date of the imaging, it is known that the eosinophil count can fluctuate from one measurement to another. However, our high cutoff point for characterizing the eosinophilic phenotype might have mitigated such variations. As previously mentioned, the precise cutoff point to identify patients with eosinophilic COPD has yet to be established. Our choice of an eosinophil count in peripheral blood of 300 cells/µL as the cutoff point might also be construed as a limiting factor. In a previous study evaluating the relationship between peripheral eosinophils and emphysema(18), the authors showed that patients with significant emphysema observed on chest CT scans had low eosinophil counts in peripheral blood (mean, 34.6 cells/µL) in comparison with the patients with no significant emphysema (mean, 169 cells/µL), although no patients with an eosinophil count over 300 cells/µL were included in that study. In the present study, we did not observe a relationship between peripheral eosinophilia and the quantitative emphysema score, as evaluated by chest CT. Further studies, especially prospective studies, are warranted in order to evaluate the clinical, functional, and CT characteristics of patients with eosinophilic COPD. That could help establish the best cutoff point to define this population and thus enable the use of treatments that are more aggressive. REFERENCES 1. Singh D, Agusti A, Anzueto A, et al. Global strategy for the diagnosis, management, and prevention of chronic obstructive pulmonary disease: the GOLD science committee report 2019. Eur Respir J. 2019;53:1900164. 2. Lowe KE, Regan EA, Anzueto A, et al. COPDGene® 2019: redefining the diagnosis of chronic obstructive pulmonary disease. Chronic Obstr Pulm Dis. 2019;6:38499. 3. Wedzicha JA, Banerji D, Chapman KR, et al. Indacaterol-glycopyrronium versus salmeterol-fluticasone for COPD. N Engl J Med. 2016;374:222234. 4. Camp J, Cane JL, Bafadhel M. Shall we focus on the eosinophil to guide treatment with systemic corticosteroids during acute exacerbations of COPD?: PRO. Med Sci (Basel). 2018;6:74. 5. Barnes NC, Sharma R, Lettis S, et al. Blood eosinophils as a marker of response to inhaled corticosteroids in COPD. Eur Respir J. 2016;47:137482. 6. Long GH, Southworth T, Kolsum U, et al. The stability of blood eosinophils in chronic obstructive pulmonary disease. Respir Res. 2020;21:15. 7. Bu T, Wang LF, Yin YQ. How do innate immune cells contribute to airway remodeling in copd progression? Int J Chron Obstruct Pulmon Dis. 2020;15:10716. 8. Lynch DA, Al-Qaisi MA. Quantitative computed tomography in chronic obstructive pulmonary disease. J Thorac Imaging. 2013; 28:28490. 9. Chen A, Karwoski RA, Gierada DS, et al. Quantitative CT analysis of diffuse lung disease. Radiographics. 2020;40:2843. 10. Achenbach T, Weinheimer O, Biedermann A, et al. MDCT assessment of airway wall thickness in COPD patients using a new method: correlations with pulmonary function tests. Eur Radiol. 2008;18:27318. 11. Pagano M, Gauvreau K. Princípios de bioestatística. 1ª ed. São Paulo: Cengage Learning Brasil; 2004. 12. Magnussen H, Disse B, Rodriguez-Roisin R, et al. Withdrawal of inhaled glucocorticoids and exacerbations of COPD. N Engl J Med. 2014;371:128594. 13. Watz H, Tetzlaff K, Wouters EFM, et al. Blood eosinophil count and exacerbations in severe chronic obstructive pulmonary disease after withdrawal of inhaled corticosteroids: a post-hoc analysis of the WISDOM trial. Lancet Respir Med. 2016;4:3908. 14. Ferguson GT, Rabe KF, Martinez FJ, et al. Triple therapy with budesonide/glycopyrrolate/formoterol fumarate with co-suspension delivery technology versus dual therapies in chronic obstructive pulmonary disease (KRONOS): a double-blind, parallel-group, multicentre, phase 3 randomised controlled trial. Lancet Respir Med. 2018;6:74758. 15. Harries TH, Rowland V, Corrigan CJ, et al. Blood eosinophil count, a marker of inhaled corticosteroid effectiveness in preventing COPD exacerbations in post-hoc RCT and observational studies: systematic review and meta-analysis. Respir Res. 2020;21:3. 16. Doyle AD, Mukherjee M, LeSuer WE, et al. Eosinophil-derived IL-13 promotes emphysema. Eur Respir J. 2019;53:1801291. 17. Litmanovich D, Boiselle PM, Bankier AA. CT of pulmonary emphysema current status, challenges, and future directions. Eur Radiol. 2009;19:53751. 18. Papaioannou AI, Kostikas K, Papaporfyriou A, et al. Emphysematous phenotype is characterized by low blood eosinophils: a cross-sectional study. COPD. 2017;14:63540. Complexo Hospital de Clínicas, Universidade Federal do Paraná (UFPR), Curitiba, PR, Brazil a. https://orcid.org/0000-0002-9884-6367 b. https://orcid.org/0000-0001-8733-0755 c. https://orcid.org/0000-0002-3409-4944 d. https://orcid.org/0000-0001-7889-9405 e. https://orcid.org/0000-0003-4917-6747 f. https://orcid.org/0000-0002-4572-4315 g. https://orcid.org/0000-0002-8978-4897 Correspondence: Giovanna Lemes Leão Rua Padre Saboya de Medeiros, 259, Planalto São Bernardo do Campo, SP, Brazil, 09890-540 Email: giovanna.leao@yahoo.com Received 1 June 2021 Accepted after revision 17 August 2021 Publication date: 13/12/2021 |
|
Av. Paulista, 37 - 7° andar - Conj. 71 - CEP 01311-902 - São Paulo - SP - Brazil - Phone: (11) 3372-4544 - Fax: (11) 3372-4554