Radiologia Brasileira - Publicação Científica Oficial do Colégio Brasileiro de Radiologia
AMB - Associação Médica Brasileira CNA - Comissão Nacional de Acreditação
 Vol. 51 nº 3 - May / June of 2018
|
REVIEW ARTICLE
|
|
Pulmonary thromboembolism: new diagnostic imaging techniques |
|
|
Autho(rs): Julia Noschang1; Marcos Duarte Guimarães2; Diogo Fábio Dias Teixeira3; Juliana Cristina Duarte Braga3; Bruno Hochhegger4; Pablo Rydz Pinheiro Santana5; Edson Marchiori6 |
|
|
Keywords: Pulmonary embolism; Tomography, emission-computed/methods; Tomography, X-ray computed/methods; Computed tomography, dual-energy scanned projection; Ventilation-perfusion ratio. |
|
|
Abstract: INTRODUCTION
Pulmonary thromboembolism (PTE) is a common clinical entity that results in morbidity and mortality in a large number of patients. PTE is the third leading cause of cardiovascular death in the United States(1), with an incidence rate of 0.51.0 per 1000 person-years(2). Studies on the epidemiology of PTE in Brazil are rare. Most such studies analyze autopsy data and show that, under those conditions, the prevalence of PTE ranges from 3.9% to 16.6%(3,4). Therefore, although PTE occurs frequently, the diagnosis continues to be a great clinical challenge, because the same signs and symptoms are present in a large number of diseases, as well as because the risk factors associated with PTE are nonspecific. The diagnosis of PTE is based on the following(1): the clinical pre-test probability; the D-dimer level; and the findings in the image. The imaging methods currently available for the diagnosis are conventional chest X-ray, pulmonary angiography, ventilation-perfusion lung scintigraphy, magnetic resonance imaging (MRI) of the chest, computed tomography (CT) of the chest(5), and dual-energy CT (DECT), which is the method developed most recently(6). Although the concept of DECT originated in 1970, it was not incorporated into clinical practice until recently, when advancements in CT scanner technology, including single- and dual-source configurations, made it feasible(7). In imaging of the chest, DECT has been used for the clinical evaluation of pulmonary emphysema, pulmonary nodules, ground glass opacities, lung cancer, as well as for the diagnosis of acute PTE, chronic PTE, and chronic thromboembolic pulmonary hypertension(8). In this review article, we analyze the importance of the diagnosis of PTE, as well as the available imaging methods, with an emphasis on DECT. EVALUATION OF PATIENTS WITH PTE The diagnostic evaluation of a patient with suspected PTE begins with the analysis of the pre-test probability and association with the D-dimer level. Such evaluations are typically based on one of the two most extensively validated criteriathe Wells score(9) and the Geneva score(10)which are detailed in Tables 1 and 2, respectively. The presence of risk factors is an essential condition for clinical suspicion. The following are the main risk factors for PTE(11): surgical or nonsurgical trauma; age greater than 40 years; venous thromboembolism; immobilization; malignant disease; cardiac insufficiency; myocardial infarction; paralysis of the lower limbs; obesity; varicose veins; high estrogen level; childbirth; and chronic obstructive pulmonary disease. 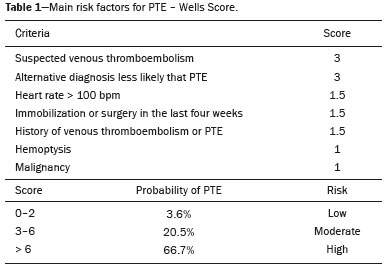 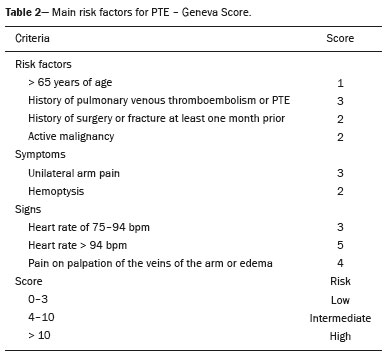 Another notable situation is the identification of PTE as an incidental finding. In the general population, PTE is detected incidentally in 1.01.5% of imaging studies performed for another purpose(12). It is believed that PTE can be overlooked in such imaging studies because of the small caliber of the arteries involved, as well as because the underlying disease can have thoracic manifestations, which can confuse the radiologist in the complete evaluation of the pulmonary arteries(13). IMAGING EVALUATION OF PATIENTS WITH SUSPECTED PTE Conventional chest X-ray In patients with PTE, conventional chest X-ray can show nonspecific signs. In 1940, Hampton et al.(14) described the classic radiographic appearance of pulmonary infarction, which became known as Hampton''s hump, a wedge-shaped peripheral consolidation with its base facing the pleural surface. Subsequently, a number of imaging patterns were associated with pulmonary infarction: peripheral consolidation without air bronchogram; aseptic excavation; and consolidation containing radiolucent areas (distinct from air bronchograms). Other signs have also been reported to be associated with PTE(1), primarily the Westermark sign (hypovolemia in the region of the lung irrigated by the occluded vessel); elevation of the ipsilateral hemidiaphragm; proximal enlargement of the pulmonary artery; atelectasis; and pleural effusion. The most common abnormalities are atelectasis, small pleural effusions, and localized reduction in the peripheral blood flow, with or without distension of the proximal vessels. Atelectasis results in a loss of volume in the lower zones, caused by ischemia, which induces surfactant deficiency(15). Although conventional chest X-ray findings are abnormal in most cases of PTE, they are normal in 40% of cases(16). Pulmonary angiography Pulmonary angiography is an invasive diagnostic method in which an intravenous catheter is introduced into the proximal pulmonary artery and the contrast medium is injected rapidly. The technique offers high spatial resolution, allowing direct evaluation of the pulmonary arterial tree. Filling defects within the contrast column are typical findings in PTE (Figure 1). Although pulmonary angiography is considered the gold standard method, it can lead to complications, mainly anaphylaxis, contrast-induced nephrotoxicity, cardiac events, and pulmonary complications(11). Among patients undergoing pulmonary angiography, fatal complications occur in 0.5%, major complications (life-threatening events that do not respond to therapy and require intensive care or prolonged hospitalization) occur in 1%, and minor complications (requiring long-term follow-up but regressing spontaneously without residual damage) occur in 5%(17). 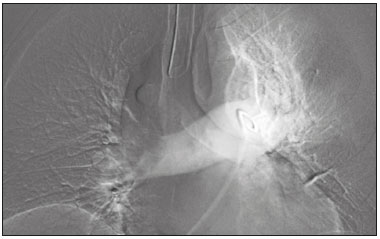 Figure 1. Pulmonary arteriography identifying bilateral pulmonary trunk filling defect, with preservation of the contrast opacification only in the apical posterior segment. Ventilation-perfusion lung scintigraphy Ventilation-perfusion lung scintigraphy is aimed at identifying ventilation in regions without perfusion, at a location distal to obstructing emboli (Figure 2), which is suggestive of a diagnosis of PTE. On the basis of the scintigraphic findings, the probability of embolism is classified as follows: high; intermediate; low; very low; or nonexistent. Scintigraphy findings indicating a high probability confirm the diagnosis of PTE, whereas those indicating a very low or nonexistent probability allow the diagnosis to be excluded. However, the limitation of ventilation-perfusion scintigraphy is related to a high number of patients in whom the findings are not conclusive. In the Prospective Investigation of Pulmonary Embolism Diagnosis (PIOPED) study, ventilation-perfusion scintigraphy was unable to establish or exclude the diagnosis of PTE in two thirds of the patients who underwent the examination(18). 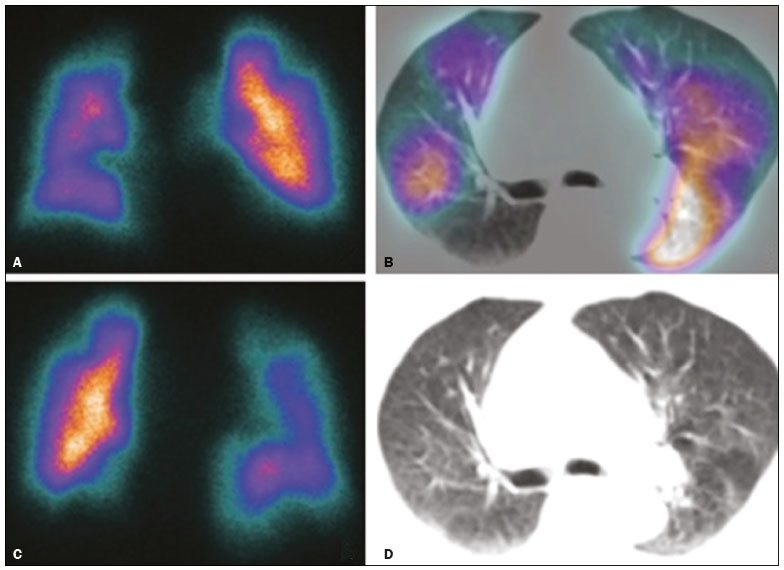 Figure 2. Pulmonary perfusion scintigraphy in coronal sections (A,B) and SPECT/CT in axial sections (C,D) in a 77-year-old male patient, demonstrating multiple wedge-shaped perfusion defects bilaterally, without parenchymal alterations, indicating a high probability of PTE. The anatomical data obtained with single-photon emission CT (SPECT)/CT can be associated with the functional data obtained with scintigraphy. There have been few studies on the utility of SPECT/CT in the diagnosis of PTE, and there are no definitive recommendations regarding the method. However, it is believed that SPECT/CT has a high (99%) accuracy for the diagnosis, with a sensitivity of 97100% and a specificity of 83100%(19,20). MRI of the chest The development of new MRI techniques, which reduce acquisition time, increase resolution and decrease movement artifacts, has allowed the use of this method for the diagnosis of PTE. The sensitivity and specificity of MRI for the evaluation of PTE are 78100% and 95100%, respectively(21,22). The PIOPED III study evaluated the accuracy of gadolinium-enhanced MRI. The authors found that, when the technique was appropriate, MRI showed a sensitivity and specificity of 78% and 99%, respectively, for the diagnosis of PTE. However, the mean proportion of tests considered technically suboptimal was 25%. Therefore, when the technically suboptimal images were included in the analysis, there was a 57% reduction in sensitivity(23). In another study, the concordance between multiple-detector computed tomography and MRI was found to be greater when multiple MRI techniques (real-time MRI, MRI angiography, and MRI perfusion scintigraphy) were analyzed jointly; the sensitivity and specificity of the combined MRI protocol for the diagnosis of pulmonary embolism were found to be 100% and 93%, respectively(24). Therefore, MRI, because of its high sensitivity and specificity, is an effective non-ionizing alternative for the diagnosis of PTE (Figure 3). 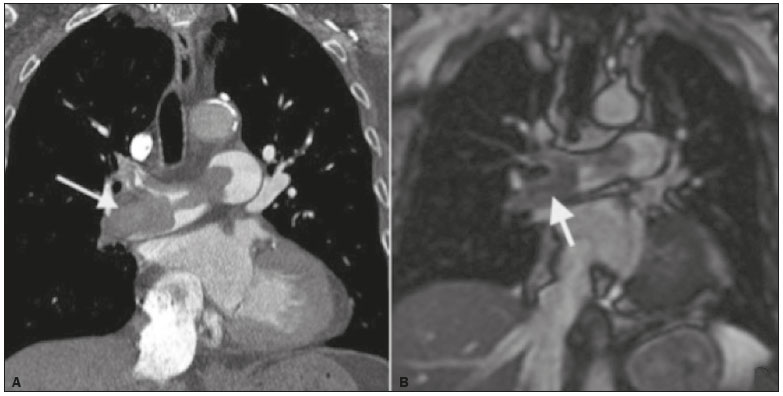 Figure 3. Correlation between a coronal CT slice (A) and a T2-weighted fast-spin-echo coronal MRI sequence (B) showing a filling defect at the pulmonary artery bifurcation. Chest CT Chest CT has been the object of a series of studies in the radiology literature of Brazil(2531). It is increasingly used for the diagnosis of PTE, being considered the standard method for this diagnosis at many facilities(32). However, the method is of limited utility for the diagnosis of small peripheral emboli, reportedly missing 53% of cases of peripheral or subsegmental PTE(33). For the diagnosis of PTE, chest CT is performed with the use of intravenous iodinated contrast medium. For intravenous access, an 18- or 20-gauge catheter is inserted, preferentially into an antecubital vein. The contrast medium is injected in a volume of 135 mL, at an infusion rate of 4 mL/s. The images are displayed in three different gray scales: a lung window with a width/level of 1500/600 Hounsfield Unity (HU); a mediastinal window with a width/level of 400/40 HU; and specific window for pulmonary embolism with a width/level of 700/100 HU(34). The diagnosis of PTE by CT is based on the identification of intraluminal filling defects on contrast-enhanced images. The diagnostic criteria for acute PTE include the following (Figure 4): arterial occlusion with filling defects throughout the lumen, the artery being occluded and its diameter being increased in comparison with the adjacent vessels; partial contrast filling defect, producing the "polo mint" sign in images perpendicular to the long axis of the vessel and the "tram-track" sign in images acquired along that axis; and peripheral filling defects forming acute angles with the arterial wall. The following are the diagnostic criteria for chronic PTE (Figure 5): complete occlusion of a vessel that is of a smaller caliber than the adjacent vessel; a crescent-shaped peripheral filling defect forming an obtuse angle with arterial wall; uneven flow of the contrast agent, often associated with arterial recanalization; and the presence of a "web" within a contrast-filled artery(34). 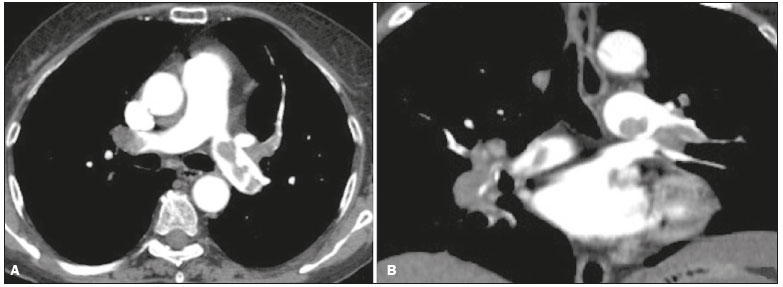 Figure 4. Acute PTE in a 62-year-old female patient. CT slices, in axial and coronal views (A and B, respectively), showing an extensive irregular filling defect in the right and left pulmonary arteries, extending to its segmental branches. 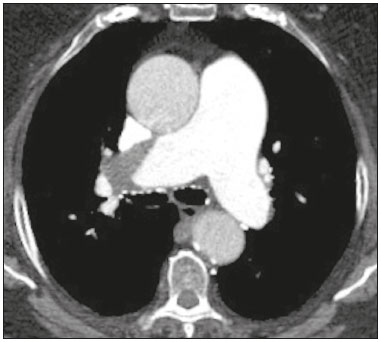 Figure 5. Chronic PTE in an 86-year-old female patient with a history of breast cancer. Axial CT scan showing a filling defect with obtuse margins in the right pulmonary artery, with patent flow in the distal bed. OVERVIEW OF DECT Basic principles The DECT method is based on the premise that materials behave differently when exposed to X-ray photons of different energies. Therefore, it allows materials with different molecular compositions to be distinguishing on the basis of their attenuation(35,36). The development of DECT was made possible by modifications to conventional CT scanners, the various modifications resulting in different DECT systems. The first involved the use of single source CT scanners with the acquisition of two sequential sets of images with different photon spectra (for example, 80 kVp followed by 140 kVp). One significant limitation of sequential dual-energy CT is alteration of the post-reconstruction contrast enhancement over time, which compromises the measurement of the decomposition of the material in question. The simultaneous acquisition of images at two different energies eliminates this limitation, and post-processing algorithms allow the materials to be differentiated. Currently, there are two DECT techniques that have been approved by the US Food and Drug Administration for clinical use(35,37): dual-source TC scanners; and single-source CT scanners with rapid voltage switching. The increased clinical use of DECT was accompanied by concern about the amount of radiation involved in the use of the technique. A number of studies have compared the use of conventional CT with that of DECT and have concluded that neither method involves greater or lesser exposure to radiation than the other. Few of those studies focused on the normalization of image quality, the signal-to-noise ratio, or the dose-length product(38). However, it is believed that the DECT is feasible without additional radiation, and there is no significant difference in the image noise, because the contrast-to-noise ratio can be improved by optimizing DECT reconstructions(32). It is also of note that the studies evaluating single-source CT with rapid voltage switching have produced inconclusive results(38). Post-processing techniques Two approaches are used in order to obtain post-processing information. One is to subtract equivalent projections and apply filtering to earlier projections to reconstruct the differences in the spectral information. Another way is to reconstruct standard CT images into voxels (in HU) and use post-processing algorithms to extract specific spectral information based on the differences between the corresponding voxels. Currently, the latter is the most commonly used approach, with an image reconstruction system characterized by low and high kilovoltage, as well as a series of reproductions with the weighted mean(37). The main post-processing image reconstruction techniques used in DECT are iodine maps, virtual non-contrast-enhanced images, and virtual monochromatic images(35,36). For the diagnosis of PTE, iodine mapping allows the visualization of the distribution and amount of the substance in the pulmonary parenchyma, which is related to pulmonary perfusion. Dual-source DECT uses a decomposition algorithm based on three materials with known low- and high-energy X-ray absorption properties (iodine, soft tissues, and fat). The estimated quantity of each material is calculated based on its attenuation profile at different energy levels; thus, an iodine-specific map is generated by determining the amount of iodine in the tissue (in HU). Single-source DECT uses a decomposition algorithm based on two materials in the projection space. The low- and high-energy attenuation values for the two materials selected (water and iodine) are mathematically transformed to calculate the values that would be required to determine those levels of attenuation(35). For the evaluation of iodine, the images can be displayed quantitatively, as a grayscale image, or qualitatively, in the form of a colored map. Both forms provide an indirect assessment of the microvascular environment of the underlying tissue. In dual-source DECT, the quantity of iodine is expressed in HU, the mean value representing the degree of enhancement. In the single-source method, the quantity of iodine is expressed in milligrams per milliliter. Another way of evaluating pulmonary perfusion through CT is the technique of subtracting a post-contrast phase from a pre-contrast phase, creating iodine maps similar to those provided by DECT(39). Diagnosis of PTE To the morphological information provided by CT, the use of DECT adds data regarding pulmonary parenchymal perfusion through iodine mapping, which allows the visualization of the iodine distribution in the parenchyma(36), as depicted in Figure 6. The use of iodine mapping in DECT is expected to improve the accuracy of the diagnosis of PTE, especially for segmental and subsegmental PTE (Figure 7), because small segmental and subsegmental thrombi may not be detected by CT in clinical radiology practice. 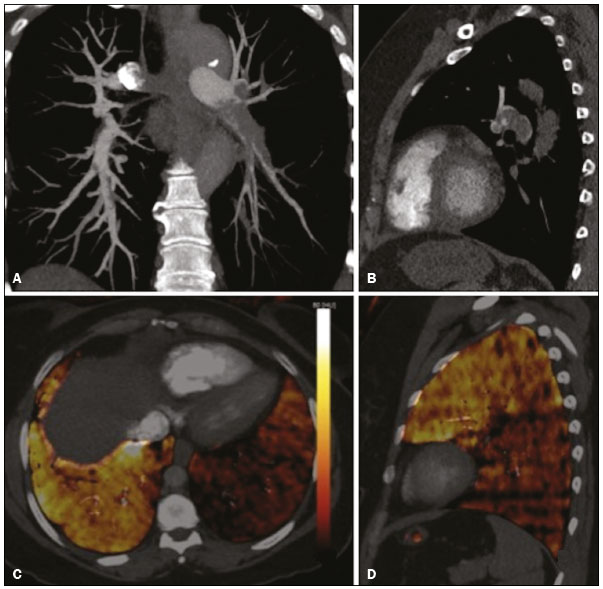 Figure 6. CT slices, in coronal and sagittal views (A and B, respectively), showing extensive filling defects affecting the pulmonary artery branches, mainly in the left lower lobe. Dual-energy CT, in axial and sagittal views (C and D, respectively), demonstrating an extensive perfusion defect in the left lower lobe due to acute PTE. 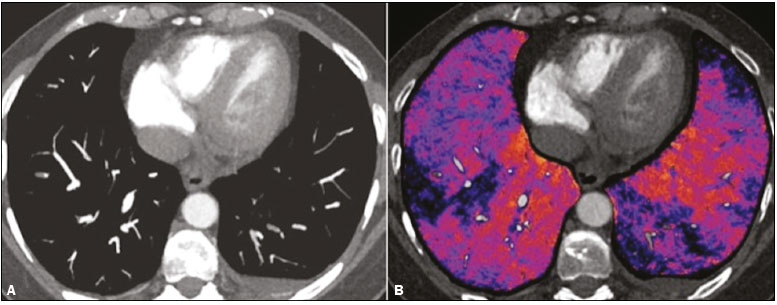 Figure 7. Axial CT slice (A) and iodine map created by the subtraction technique (B) showing bilateral filling defects in the subsegmental branches in correlation with the associated perfusion defects. Studies evaluating the use of DECT have shown that it is superior to conventional CT for the detection of PTE. One experimental study showed that the sensitivity for the detection of PTE was 89% for DECT, compared with 67% for conventional CT(40). In agreement with those findings, clinical studies have also demonstrated benefits of DECT use. In one such study, the per-patient sensitivity and specificity for the detection of PTE reached 100%(41), with a sensitivity of 84.6100% and a specificity of 93.3100%. However, for the detection of segmental and subsegmental PTE, DECT presents a sensitivity of 60.082.9% and a specificity of 99.599.8%(41,42). It is noteworthy that DECT shows high rates of interobserver and intraobserver agreement rates, demonstrating good applicability of the method in clinical practice(43). However, the contact of the pulmonary segments with the upper mediastinum or heart chambers is considered a limiting factor for the appropriate evaluation of PTE by DECT(44). The perfusion defects demonstrated by DECT have good agreement with the findings of ventilation-perfusion scintigraphy. In a study comparing DECT with scintigraphy in patients who underwent both techniques, with a mean interval of three days between the two examinations, the per-patient accuracy of the diagnosis showed a sensitivity of 75%, a specificity of 80%, and a negative predictive value of 93%. When assessed by lung segment, the sensitivity was 83%, the specificity was 99%, and the negative predictive value was 93%(45). In another study, comparing pulmonary perfusion with DECT and SPECT/CT, DECT demonstrated 100% sensitivity and specificity for acute PTE, whereas the combination of SPECT/CT and ventilation scintigraphy had a sensitivity of 85.7% and a specificity of 87.5%(46). Despite the fact that there are a limited number of studies comparing pulmonary perfusion demonstrated by iodine mapping with that demonstrated by MRI, the results are not satisfactory. To date, there appears to be no significant correlation between the two methods, which have shown only a moderate level of visual correlation(47). Regarding DECT, the possibility of a correlation between the extent of the perfusion defect and the prognosis should be highlighted, given that a significant increase in the volume of the perfusion defect (35% ± 11% versus 23% ± 10%, p = 0.002) has been associated with adverse clinical outcomes(48). Limitations Although DECT is a promising tool for the diagnosis of PTE, there are some challenges for its use in clinical practice. The following factors have been shown to limit the use of DECT: Scanner-related: limited access to DECT; high cost; relatively long image processing time; and smaller field of view of the B tube, which may not include the peripheral portion of the thorax, thus preventing DECT from being used for dual-energy post-processing. Patient-related: obesity can which can increase image noise, compromising the structural and functional analysis, and, in some cases, patient weight exceeds the allowable limit of the DECT scanner. Interpretation: there are a limited number of radiologists who are familiar with the technique; and the terminology has yet to be standardized. Artifacts in image interpretation Artifacts in the iodine concentration map images should be considered, in order to avoid misdiagnosis. Such artifacts are related to the contrast agent, to its physiological distribution, and to lung disease. Regions with high concentrations of iodinated contrast may cause a beam-hardening effect, resulting in locations with contrast enhancement defects adjacent to an area with high contrast enhancement. The physiological action of gravity should also be recognized, because, in tests performed in the supine position, the anterior regions of the thorax usually show less contrast enhancement. However, nonocclusive thrombi can result in false-negative results, with little enhancement defect in the corresponding region. The reduction in the number of capillaries in elderly patients and in regions with emphysema can also cause enhancement defects(49). CONCLUSION The DECT technique is capable of identifying perfusion defects with good accuracy, as well as of providing high-resolution images for the evaluation of the morphology of the lung parenchyma. Therefore, it has the potential to increase accuracy and safety in the diagnosis of PTE. REFERENCES 1. Pipavath SN, Godwin JD. Acute pulmonary thromboembolism: a historical perspective. AJR Am J Roentgenol. 2008;191:63941. 2. Laack TA, Goyal DG. Pulmonary embolism: an unsuspected killer. Emerg Med Clin North Am. 2004;22:96183. 3. White RH. The epidemiology of venous thromboembolism. Circulation. 2003;107(23 Suppl 1):I48. 4. Anderson FA Jr, Wheeler HB, Goldberg RJ, et al. A population-based perspective of the hospital incidence and case-fatality rates of deep vein thrombosis and pulmonary embolism. The Worcester DVT Study. Arch Intern Med. 1991;151:9338. 5. van Strijen MJ, de Monyé W, Kieft GJ, et al. Diagnosis of pulmonary embolism with spiral CT as a second procedure following scintigraphy. Eur Radiol. 2003;13:15017. 6. Raja AS, Greenberg JO, Qaseem A, et al. Evaluation of patients with suspected acute pulmonary embolism: best practice advice from the Clinical Guidelines Committee of the American College of Physicians. Ann Intern Med. 2015;163:70111. 7. Kaza RK, Platt JF, Cohan RH, et al. Dual-energy CT with single- and dual-source scanners: current applications in evaluating the genitourinary tract. Radiographics. 2012;32:35369. 8. Lu GM, Zhao Y, Zhang LJ, et al. Dual-energy CT of the lung. AJR Am J Roentgenol. 2012;199(5 Suppl):S4053. 9. Wells PS, Anderson DR, Rodger M, et al. Derivation of a simple clinical model to categorize patients probability of pulmonary embolism: increasing the models utility with the SimpliRED D-dimer. Thromb Haemost. 2000;83:41620. 10. Le Gal G, Righini M, Roy PM, et al. Prediction of pulmonary embolism in the emergency department: the revised Geneva score. Ann Intern Med. 2006;144:16571. 11. Volschan A, Caramelli B, Gottschall CA, et al. Guidelines for pulmonary embolism. Arq Bras Cardiol. 2004;83 Suppl 1:18. 12. Gosselin MV, Rubin GD, Leung AN, et al. Unsuspected pulmonary embolism: prospective detection on routine helical CT scans. Radiology. 1998;208:20915. 13. Gladish GW, Choe DH, Marom EM, et al. Incidental pulmonary emboli in oncology patients: prevalence, CT evaluation, and natural history. Radiology. 2006;240:24655. 14. Hampton AO, Castleman B. Correlation of post-mortem chest teleroentgenograms with autopsy findings with special reference to pulmonary embolism and infarction. Am J Roentgenol Radium Ther. 1940;40:30526. 15. Bergus GR, Barloon TS, Kahn D. An approach to diagnostic imaging of suspected pulmonary embolism. Am Fam Physician. 1996;53: 125966. 16. Greenspan RH, Ravin CE, Polansky SM, et al. Accuracy of the chest radiograph in diagnosis of pulmonary embolism. Invest Radiol. 1982;17:53943. 17. Stein PD, Athanasoulis C, Alavi A, et al. Complications and validity of pulmonary angiography in acute pulmonary embolism. Circulation. 1992;85:4628. 18. PIOPED Investigators. Value of the ventilation/perfusion scan in acute pulmonary embolism. Results of the prospective investigation of pulmonary embolism diagnosis (PIOPED). JAMA. 1990; 263:27539. 19. Gutte H, Mortensen J, Jensen CV, et al. Detection of pulmonary embolism with combined ventilation-perfusion SPECT and low-dose CT: head-to-head comparison with multidetector CT angiography. J Nucl Med. 2009;50:198792. 20. Mazurek A, Dziuk M, Witkowska-Patena E, et al. The utility of hybrid SPECT/CT lung perfusion scintigraphy in pulmonary embolism diagnosis. Respiration. 2015;90:393401. 21. Yue K. Diagnosis efficiency for pulmonary embolism using magnetic resonance imaging method: a meta-analysis. Int J Clin Exp Med. 2015;8:1441623. 22. Stein PD, Woodard PK, Hull RD, et al. Gadolinium-enhanced magnetic resonance angiography for detection of acute pulmonary embolism: an in-depth review. Chest. 2003;124:23248. 23. Stein PD, Chenevert TL, Fowler SE, et al. Gadolinium-enhanced magnetic resonance angiography for pulmonary embolism: a multicenter prospective study (PIOPED III). Ann Intern Med. 2010;152:43443, W1423. 24. Kluge A, Luboldt W, Bachmann G. Acute pulmonary embolism to the subsegmental level: diagnostic accuracy of three MRI techniques compared with 16-MDCT. AJR Am J Roentgenol. 2006; 187:W714. 25. Barbosa DL, Hochhegger B, Souza Jr AS, et al. High-resolution computed tomography findings in eight patients with hantavirus pulmonary syndrome. Radiol Bras. 2017;50:14853. 26. Belém LC, Souza CA, Souza Jr AS, et al. Metastatic pulmonary calcification: high-resolution computed tomography findings in 23 cases. Radiol Bras. 2017;50:2316. 27. Mogami R, Goldenberg T, Marca PGC, et al. Pulmonary infection caused by Mycobacterium kansasii: findings on computed tomography of the chest. Radiol Bras. 2016;49:20913. 28. Queiroz RM, Gomes MP, Valentin MVN. Pulmonary paracoccidioidomycosis showing reversed halo sign with nodular/coarse contour. Radiol Bras. 2016;49:5960. 29. Bastos AL, Corrêa RA, Ferreira GA. Tomography patterns of lung disease in systemic sclerosis. Radiol Bras. 2016;49:31621. 30. Torres PPTS, Moreira MAR, Silva DGST, et al. High-resolution computed tomography and histopathological findings in hypersensitivity pneumonitis: a pictorial essay. Radiol Bras. 2016;49:1126. 31. Ribeiro BNF, Ribeiro RN, Zanetti G, et al. Hughes-Stovin syndrome: an unusual cause of pulmonary artery aneurysms. Radiol Bras. 2016;49:2023. 32. Wittram C, Meehan MJ, Halpern EF, et al. Trends in thoracic radiology over a decade at a large academic medical center. J Thorac Imaging. 2004;19:16470. 33. Winer-Muram HT, Rydberg J, Johnson MS, et al. Suspected acute pulmonary embolism: evaluation with multi-detector row CT versus digital subtraction pulmonary arteriography. Radiology. 2004;233:80615. 34. Wittram C, Maher MM, Yoo AJ, et al. CT angiography of pulmonary embolism: diagnostic criteria and causes of misdiagnosis. Radiographics. 2004;24:121938. 35. Agrawal MD, Pinho DF, Kulkarni NM, et al. Oncologic applications of dual-energy CT in the abdomen. Radiographics. 2014;34:589612. 36. De Cecco CN, Darnell A, Rengo M, et al. Dual-energy CT: oncologic applications. AJR Am J Roentgenol. 2012;199(5 Suppl):S98S105. 37. Johnson TR. Dual-energy CT: general principles. AJR Am J Roentgenol. 2012;199(5 Suppl):S38. 38. Henzler T, Fink C, Schoenberg SO, et al. Dual-energy CT: radiation dose aspects. AJR Am J Roentgenol. 2012;199(5 Suppl):S1625. 39. Brink M, Verschoor A, Heijdra Y, et al. Subtraction techniques enable single-energy iodinemapping of pulmonary perfusion: an educational exhibit. European Congress of Radiology 2014; 2014 Mar 610; Vienna, Austria. 40. Zhang LJ, Zhao YE, Wu SY, et al. Pulmonary embolism detection with dual-energy CT: experimental study of dual-source CT in rabbits. Radiology. 2009;252:6170. 41. Fink C, Johnson TR, Michaely HJ, et al. Dual-energy CT angiography of the lung in patients with suspected pulmonary embolism: initial results. Rofo. 2008;180:87983. 42. Lee CW, Seo JB, Song JW, et al. Evaluation of computer-aided detection and dual energy software in detection of peripheral pulmonary embolism on dual-energy pulmonary CT angiography. Eur Radiol. 2011;21:5462. 43. Cai XR, Feng YZ, Qiu L, et al. Iodine distribution map in dual-energy computed tomography pulmonary artery imaging with rapid kVp switching for the diagnostic analysis and quantitative evaluation of acute pulmonary embolism. Acad Radiol. 2015;22:74351. 44. Pontana F, Faivre JB, Remy-Jardin M, et al. Lung perfusion with dual-energy multidetector-row CT (MDCT): feasibility for the evaluation of acute pulmonary embolism in 117 consecutive patients. Acad Radiol. 2008;15:1494504. 45. Thieme SF, Becker CR, Hacker M, et al. Dual energy CT for the assessment of lung perfusioncorrelation to scintigraphy. Eur J Radiol. 2008;68:36974. 46. Thieme SF, Graute V, Nikolaou K, et al. Dual energy CT lung perfusion imagingcorrelation with SPECT/CT. Eur J Radiol. 2012;81:3605. 47. Hansmann J, Apfaltrer P, Zoellner FG, et al. Correlation analysis of dual-energy CT iodine maps with quantitative pulmonary perfusion MRI. World J Radiol. 2013;5:2027. 48. Apfaltrer P, Bachmann V, Meyer M, et al. Prognostic value of perfusion defect volume at dual energy CTA in patients with pulmonary embolism: correlation with CTA obstruction scores, CT parameters of right ventricular dysfunction and adverse clinical outcome. Eur J Radiol. 2012;81:35927. 49. Lu GM, Wu SY, Yeh BM, et al. Dual-energy computed tomography in pulmonary embolism. Br J Radiol. 2010;83:70718. 1. MD, Resident in Radiology in the Department of Imaging of the A.C.Camargo Cancer Center, São Paulo, SP, Brazil 2. MD, PhD, Radiologist in the Department of Imaging of the A.C.Camargo Cancer Center, São Paulo, SP, Brazil 3. Medical Student at the Universidade Anhembi Morumbi (UAM), São Paulo, SP, Brazil 4. PhD, Adjunct Professor of Radiology at the Universidade Federal de Ciências da Saúde de Porto Alegre (UFCSPA), Porto Alegre, RS, Brazil 5. MD, Radiologist at Medimagem Hospital Beneficência Portuguesa and for Grupo Fleury, São Paulo, SP, Brazil 6. Full Professor of Radiology at the Universidade Federal do Rio de Janeiro (UFRJ), Rio de Janeiro, RJ, Brazil Study conducted in the Department of Imaging of the A.C.Camargo Cancer Center, São Paulo, SP, Brazil. Mailing address: Diogo Fábio Dias Teixeira Rua Paulo Orozimbo, 726, Cambuci São Paulo, SP, Brazil, 01535-001 E-mail: diogodiast@gmail.com Received October 17, 2017. Accepted after revision November 16, 2017. |
|
Av. Paulista, 37 - 7° andar - Conj. 71 - CEP 01311-902 - São Paulo - SP - Brazil - Phone: (11) 3372-4544 - Fax: (11) 3372-4554